

VisionLink® Productivity
VisionLink® Productivity is an easy-to-use cloud-based platform that gathers and summarizes machine telematics and jobsite data from all your equipment. Actionable performance data is transmitted to the web platform for users to access anywhere, anytime via a mobile, tablet, or desktop device - on or off the jobsite.
- Detailed payload (if equipped) and machine data is transmitted from the onboard cellular Product Link™ devices on your mixed fleet of equipment* to the web platform.
- The data is analyzed by a machine learning algorithm built within VisionLink Productivity to provide insights into jobsite productivity and equipment utilization.
- Telematics data from all subscribed machines on site is analyzed to determine machine interactions and the location of events.
- Location data is joined with fuel and payload to provide a more detailed view of the machine work done on a cycle.
- Create zones (geofences) to categorize areas and identify boundaries for improved cycle recording and tracking by zone.
- Dashboards visually summarize the data within the application, making it easier to identify trends, outliers, and patterns to optimize productivity.
* VisionLink Productivity logic can be used on legacy Cat equipment and other OEM machines can be integrated into the platform. Data field availability can vary by OEM.
- The Jobsite dashboard summarizes production and utilization details for all jobsites that have been created.
- Users can drill down to an individual jobsite and view details at each location.
The Jobsite dashboard provides:
- An overview of all created jobsites per account.
- A view of jobsite performance by the current day, the previous day, or over the past seven days.
- A comparison of key performance indicators (KPIs) across jobsites.
- The Production dashboard displays the efficiency of operations at a single jobsite.
- Detailed asset and fleet information can be reviewed, and a map view offers additional detail within customer defined zones (fill/dump, cut/load).
Available data includes four key performance indicator (KPI) categories:
- LOAD COUNT - Loads Per Day / Hour, Hauler Load Time, Loader Cycle Time
- PAYLOAD - Hourly Production, Loader Cycle Time, Payload Per Cycle / Total
- SEGMENT - Total Runtime, Empty and Loaded Stopped Time, Cycle Time
- ESTIMATED VOLUME - Hauler/Scraper Cycle Time, Cycles Per Hour, Average Pass Count/Cycle
- The Utilization dashboard allows jobsite managers to compare the performance of individual machines and fleets at a single jobsite based on the times they are working versus when they are idle.
- If a utilization issue is identified, the dashboard can be used to explore performance issues in more detail.
The Utilization dashboard provides:
- Working and Idle Hours by machine
- Fleet Working Percentage
- Fleet Long Idle Percentage (Idle Time Over 9 Minutes)
- Fleet Medium Idle Percentage (Idle Time Between 6 - 9 Minutes)
- Fleet Short Idle Percentage (Idle Time Between 3 - 6 Minutes)
- The Cost dashboard displays the working and idle costs broken down by individual machine, or by the entire fleet, while the map view allows users to see expenses by jobsite location.
- By looking at the dashboard, users can determine whether machines or jobsites are operating at higher costs than expected.
The Cost dashboard provides:
- Total Working Time Cost
- Total Idle Time Cost
- Cost Per Hour
- Cost Per Payload
- The Insights dashboard provides a deeper level of operational data for equipment at a selected jobsite.
- By analyzing insights, users can determine what is causing production and utilization issues and implement corrective measures.
The details for each machine are organized into Production, Utilization, Summary, and Map View:
- The Production tab displays cycle and asset production data.
- The Utilization tab displays asset utilization data.
- The Summary tab displays asset summary data.
- The Map view makes it easier to visualize an entire jobsite by displaying site images, asset event locations, and zone locations.
- The Assets dashboard summarizes production and utilization details for individual machines.
- Users can drill down to a particular asset and view details by date range.
Available data includes:
- Cycle Count
- Total and Average Payload
- Average Cycle/Hour
- Payload/Hour
- Runtime and Idle Hours
- Fuel Burned
Steps to get started -
* Machines equipped with Cat Payload (CPM or TPMS) may require additional hardware.
- Contact Your Cat Dealer - To ensure successful integration of VisionLink, consult with your Cat dealer during the setup process.
- Connect Your Assets* - For new Cat equipment, activate the built-in hardware. For older Cat assets and other OEM brands, install Product Link™ devices or integrate data from existing OEM or third-party telematics providers using APIs.
- Choose a Subscription - Obtain a VisionLink subscription (per machine). Your Cat Dealer can help determine the best subscription to fit your business needs.
- Implement Change Management - Utilize data-driven insights by educating users on the platform and implementing change management.
* Machines equipped with Cat Payload (CPM or TPMS) may require additional hardware.
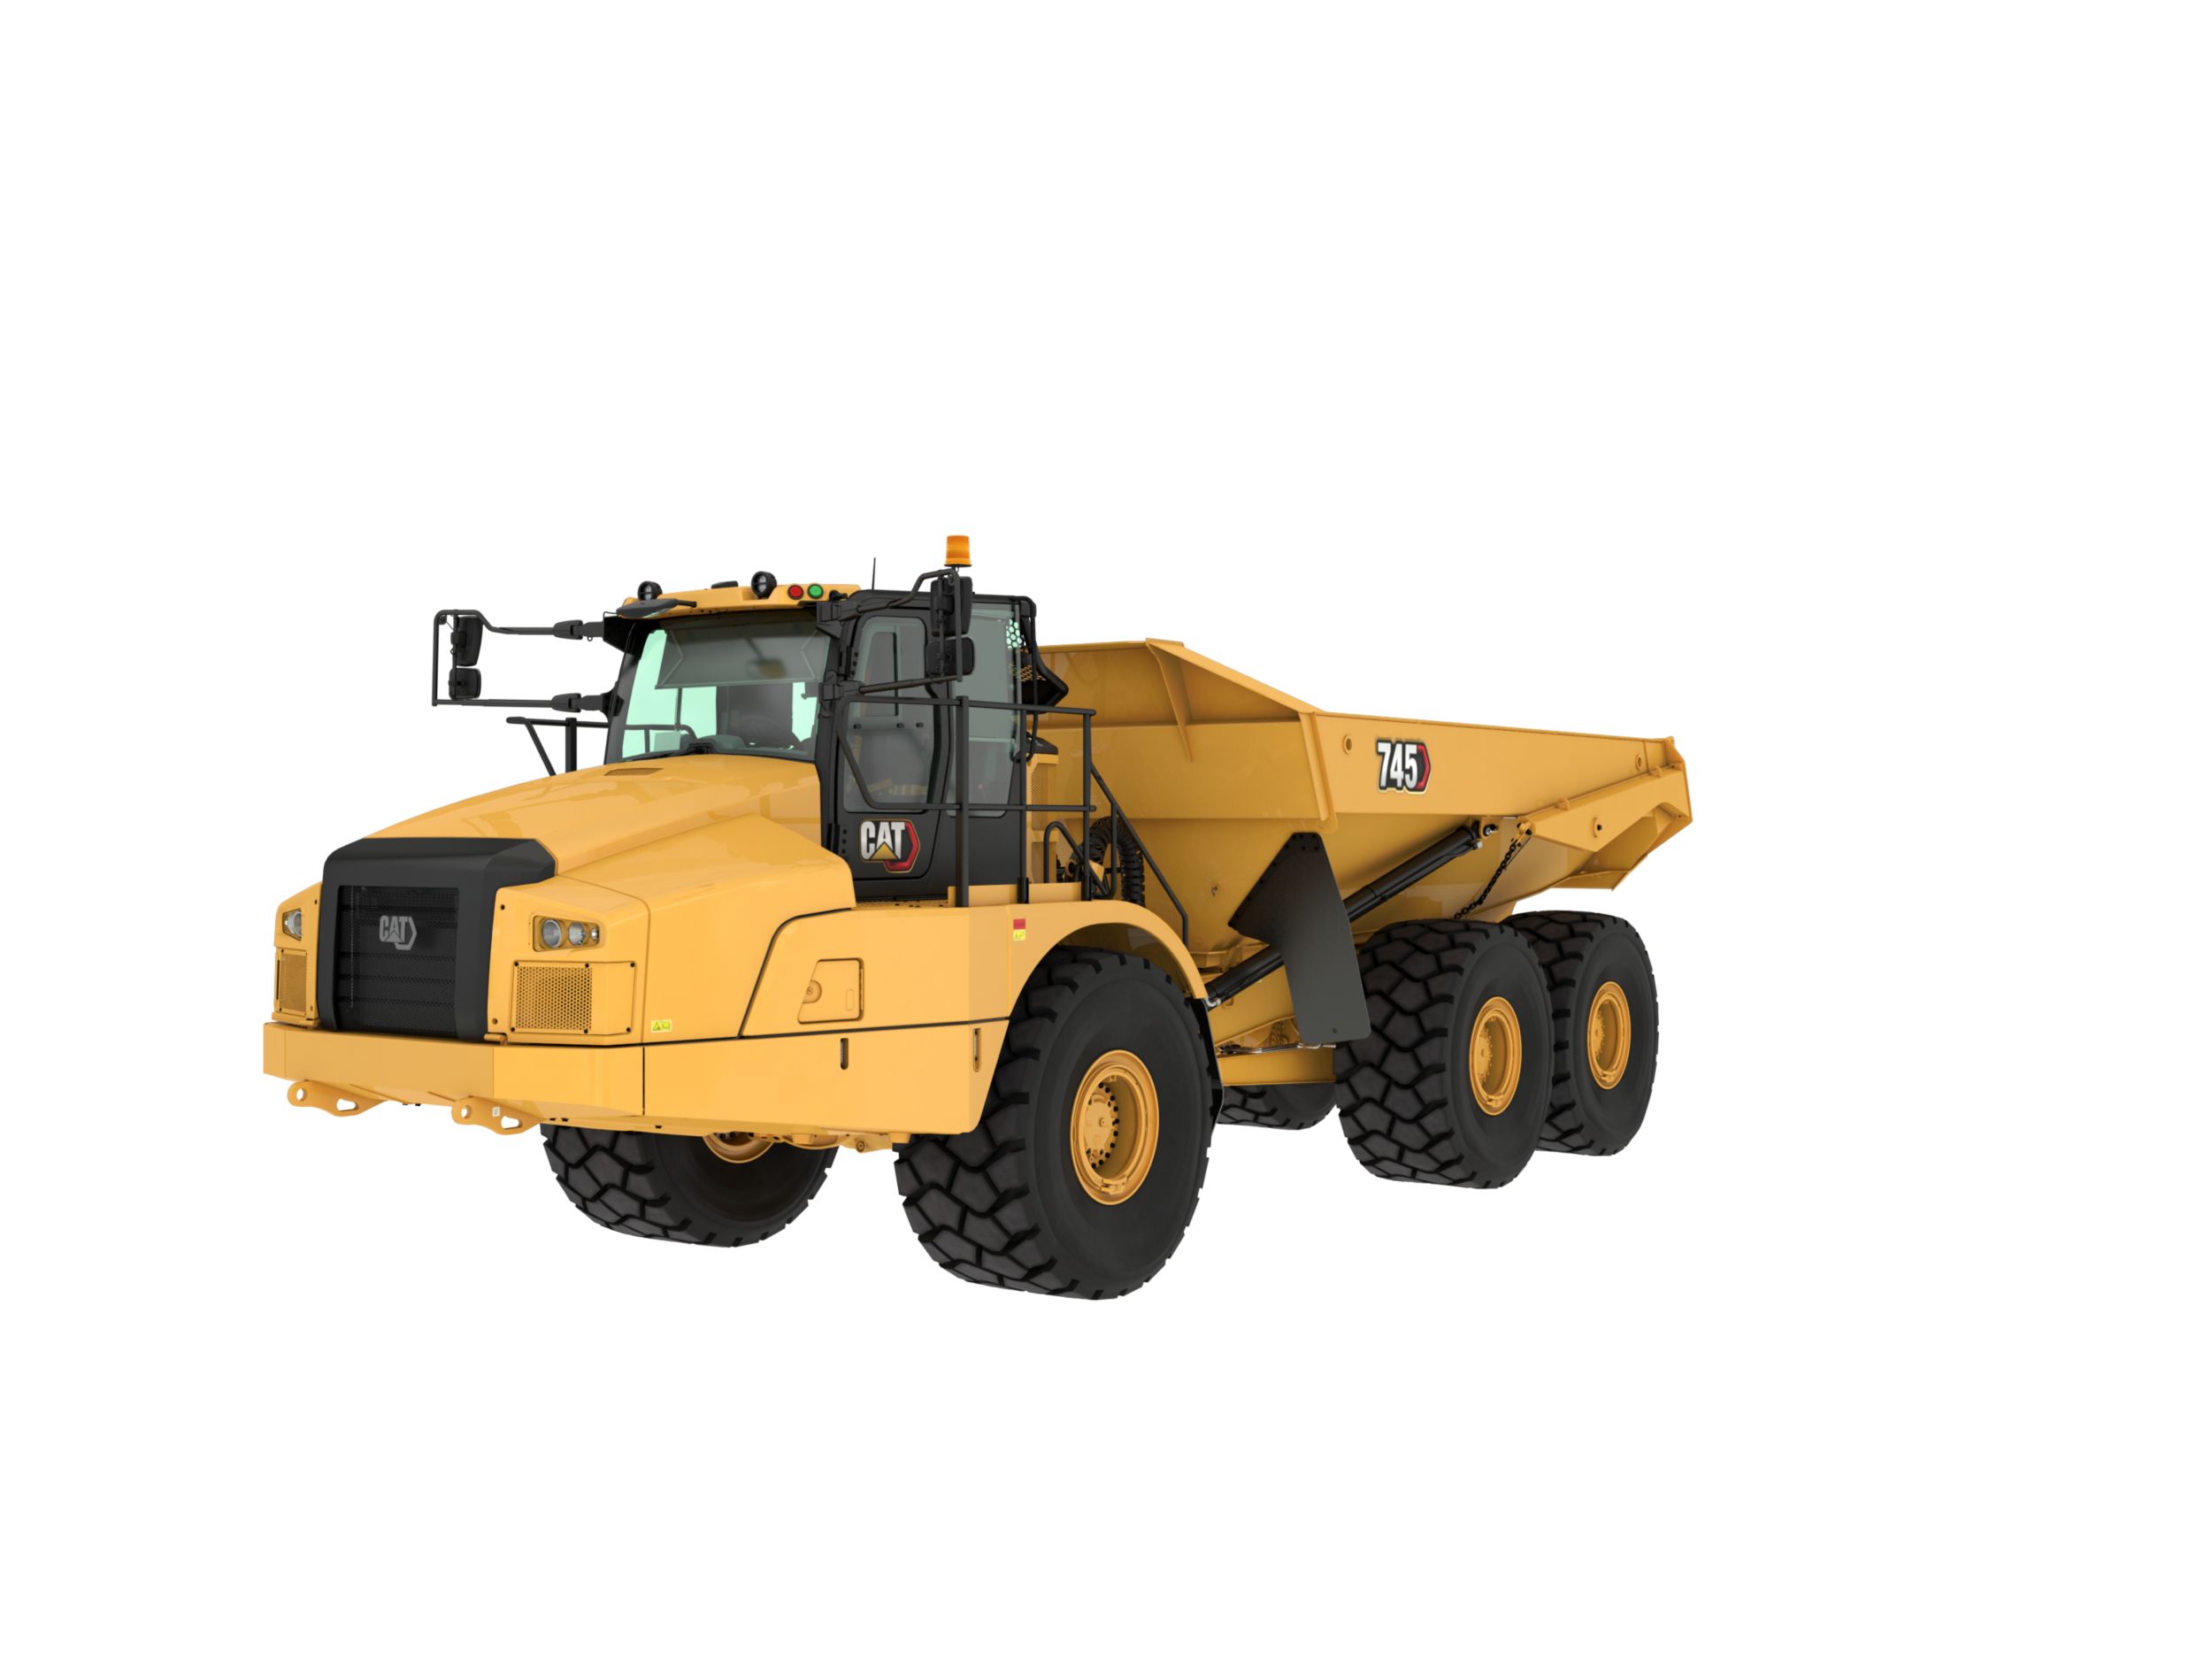
745
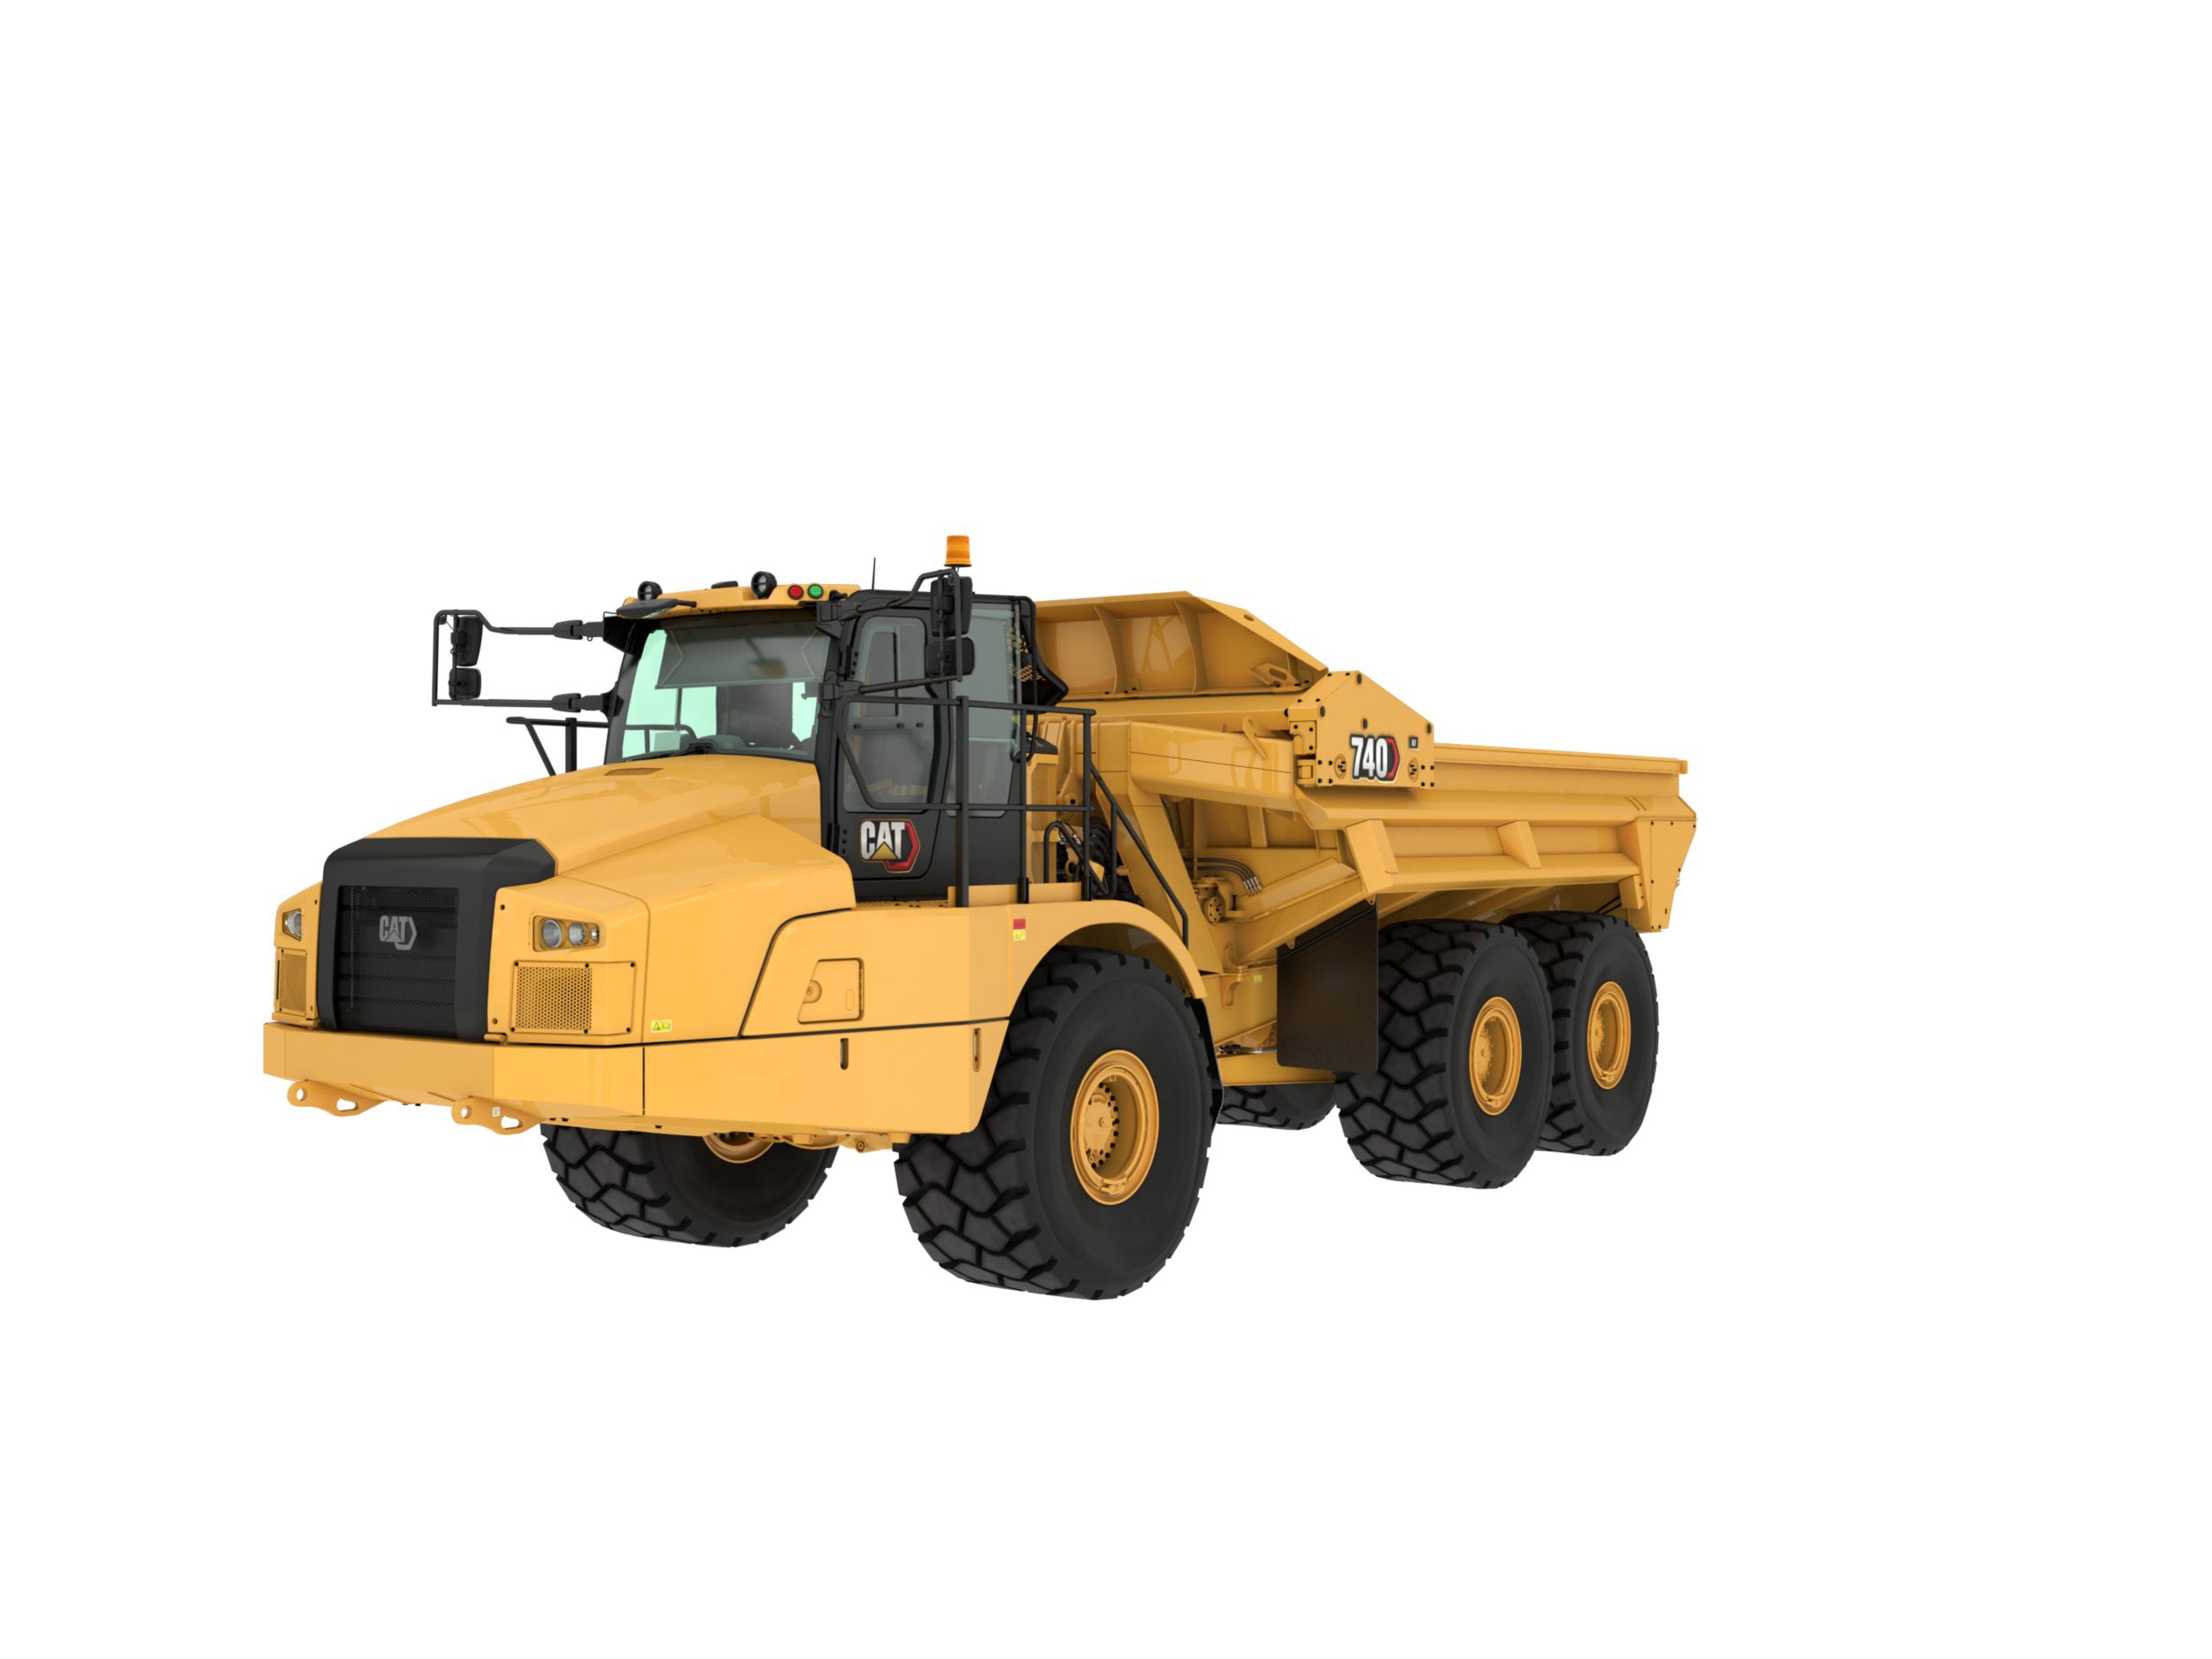
740 EJ
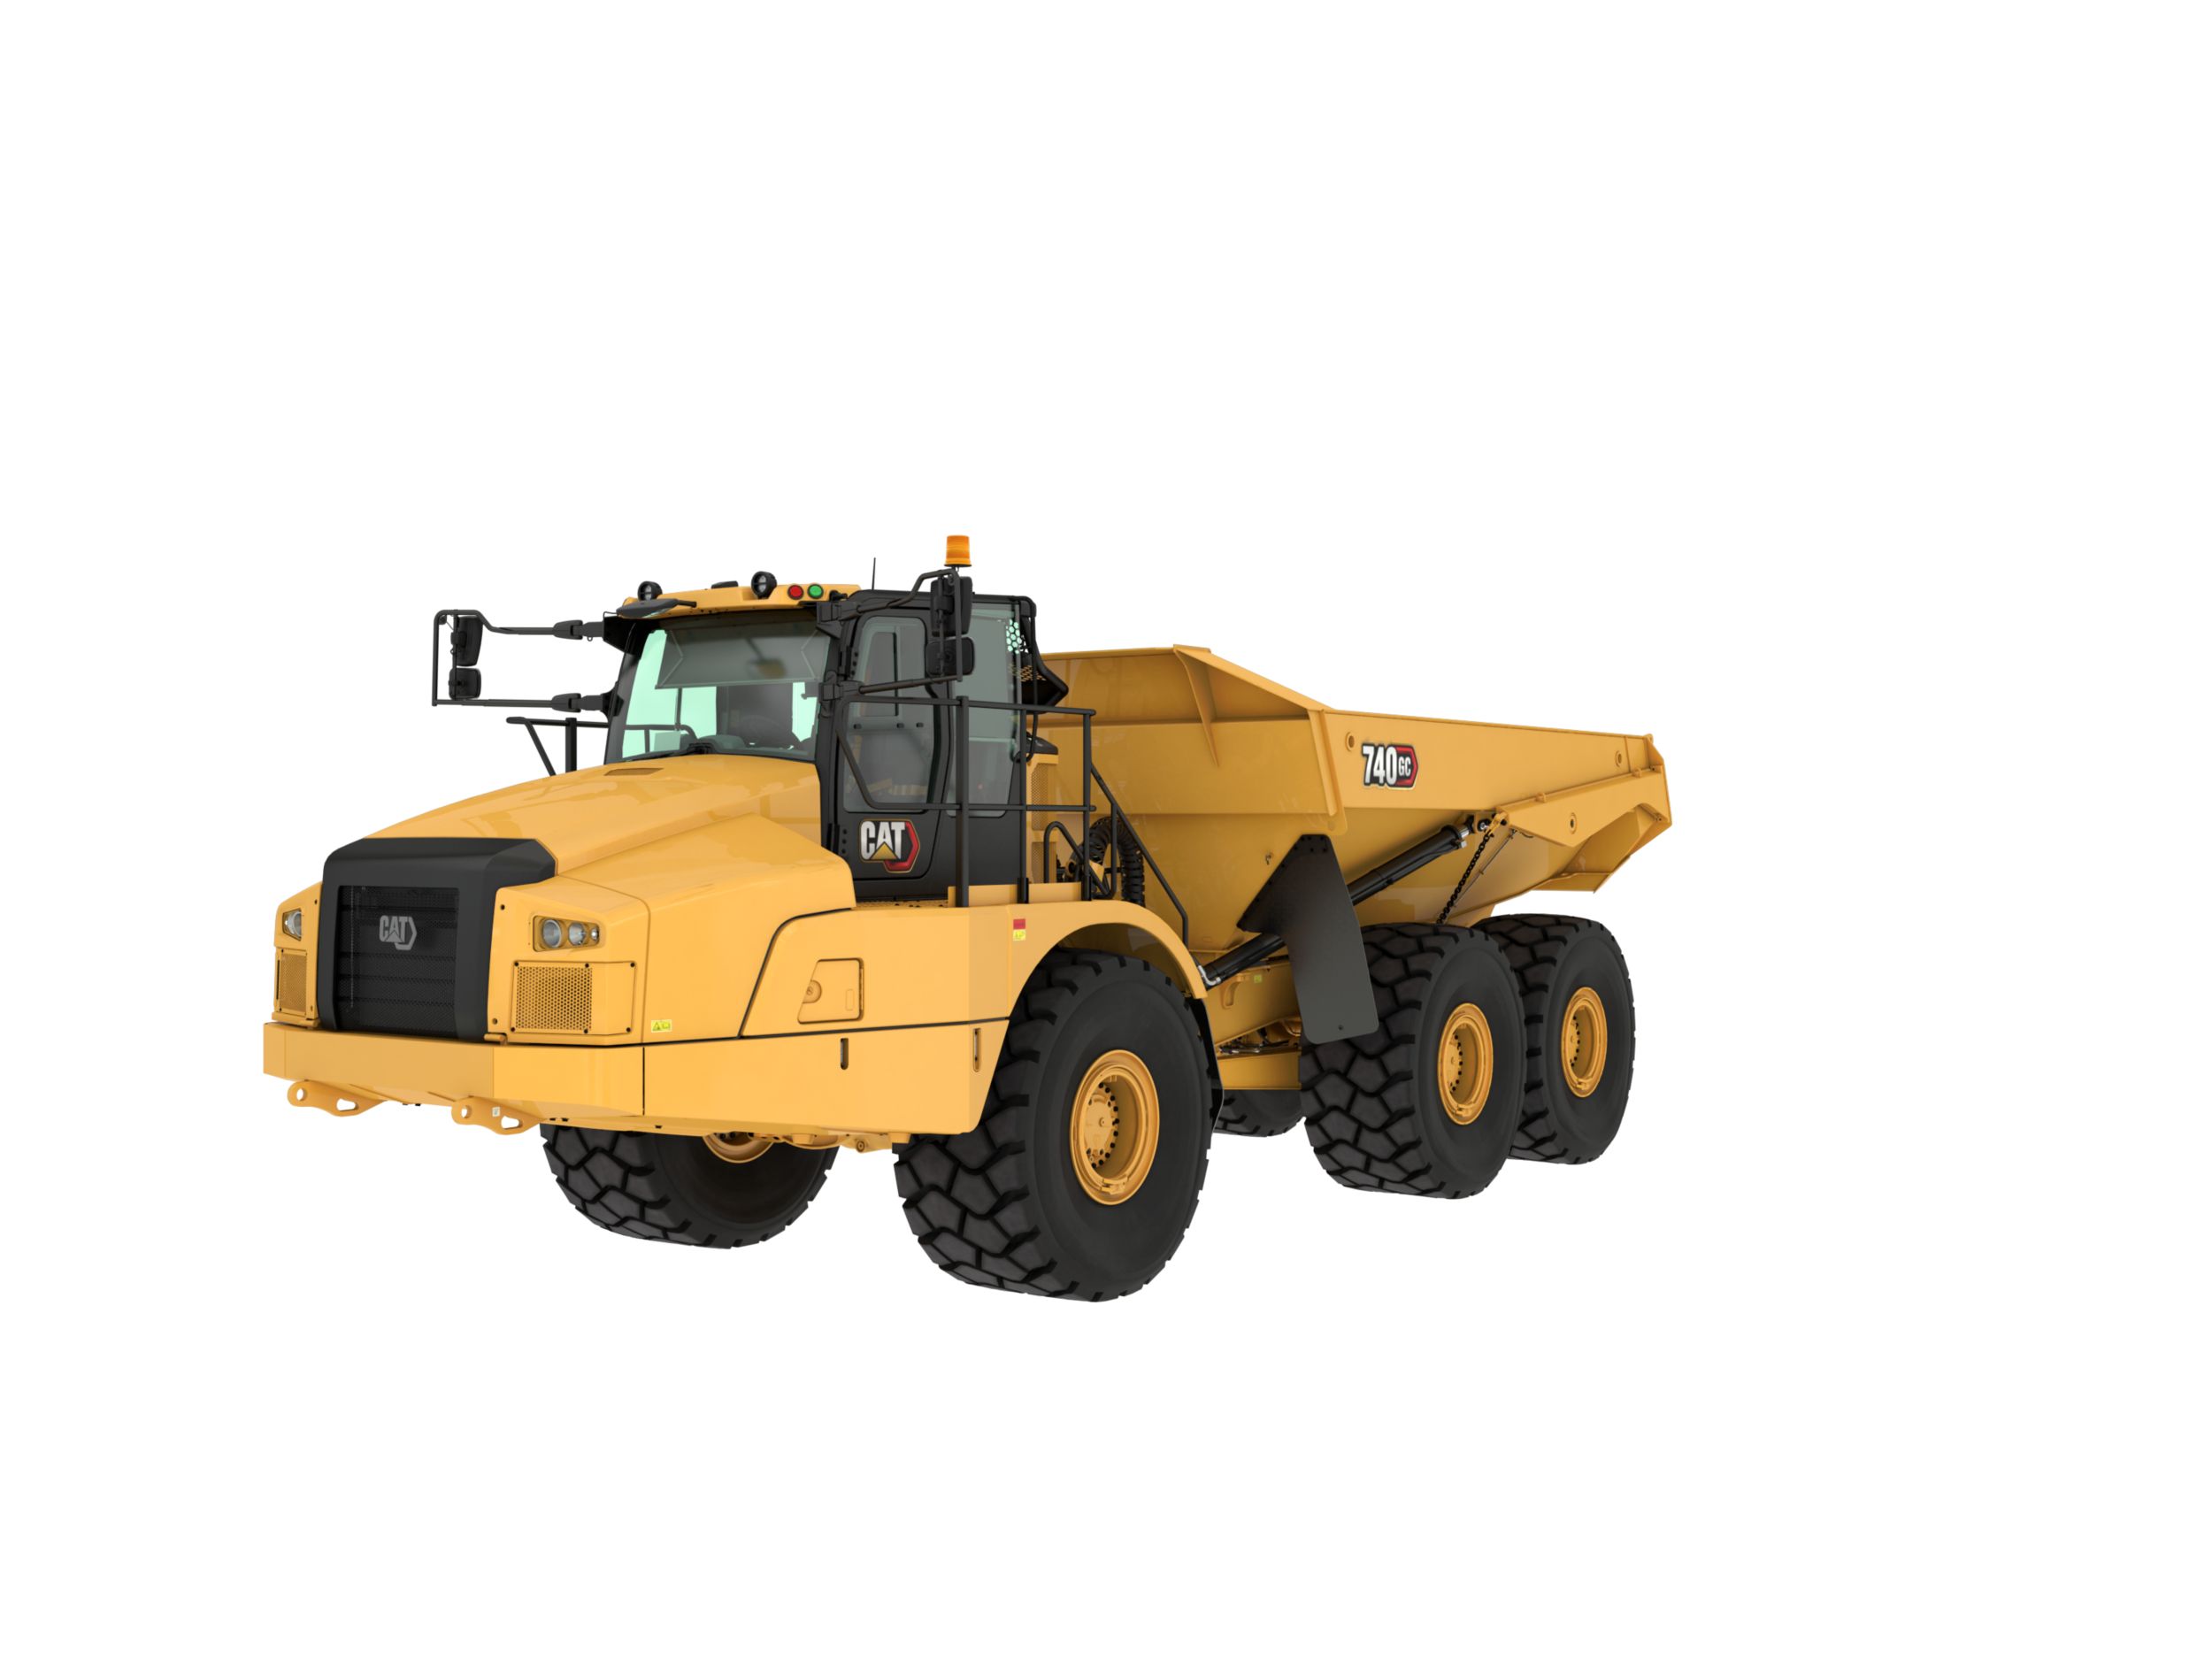
740 GC
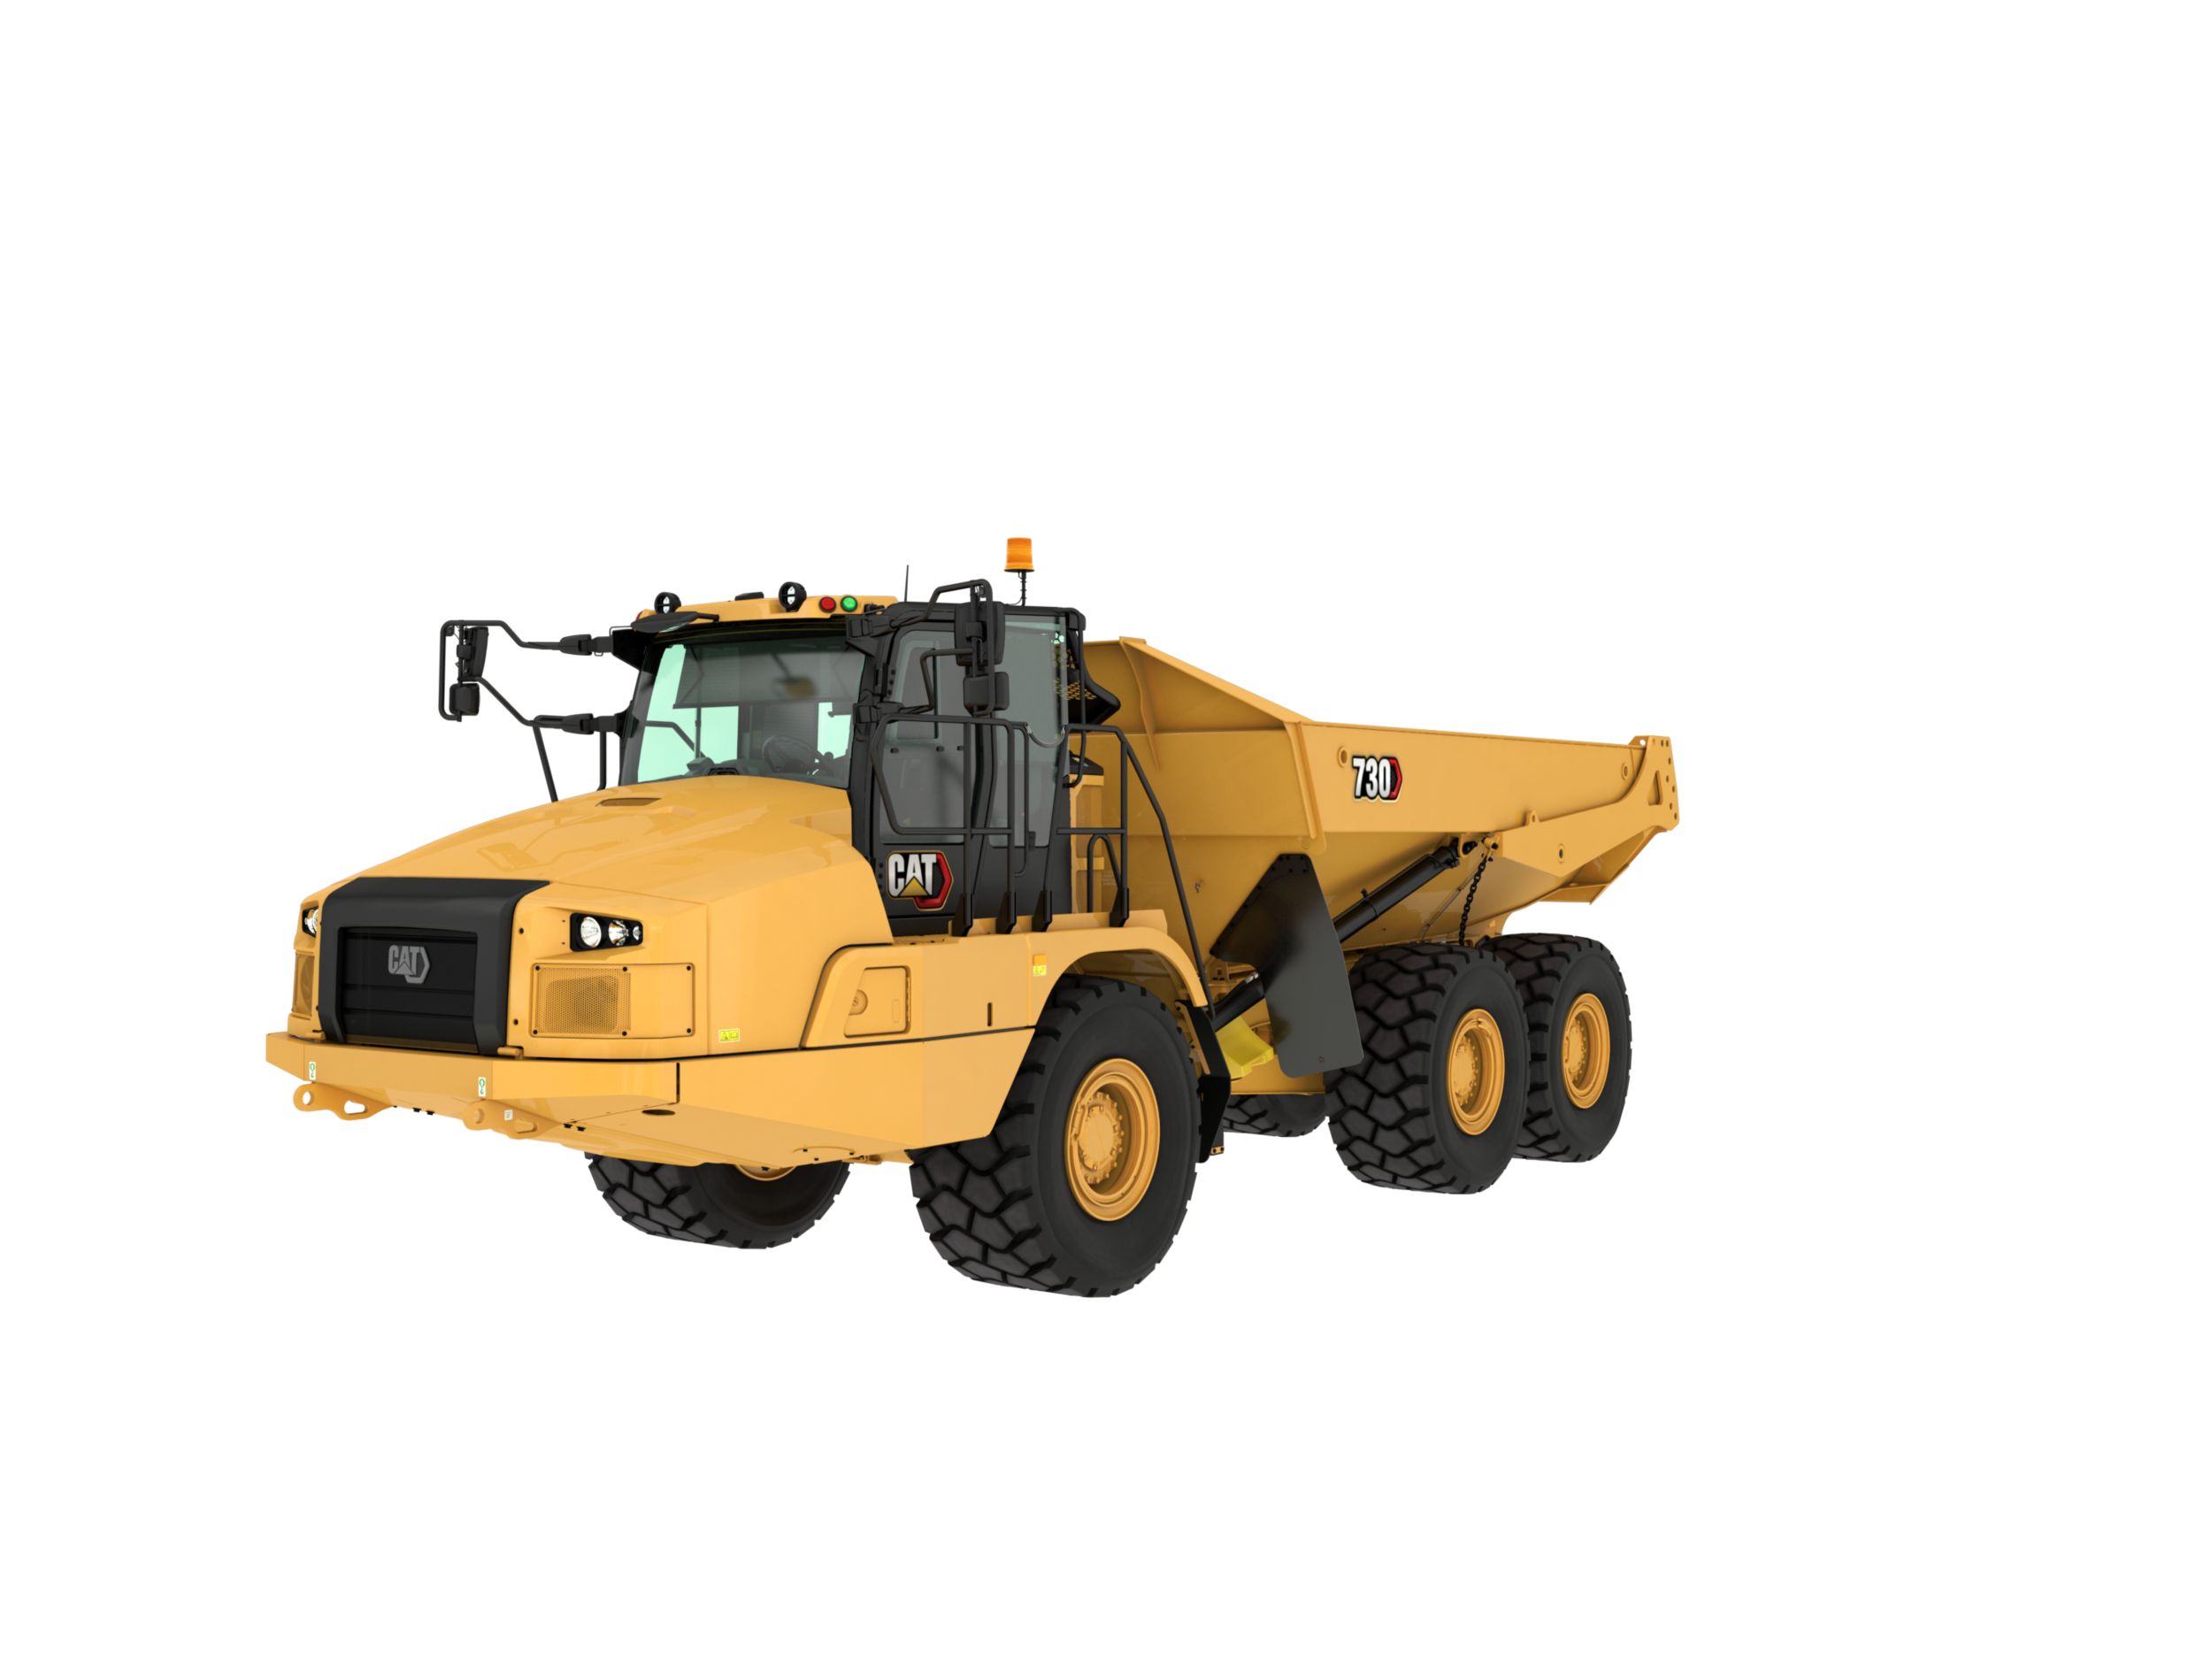
730
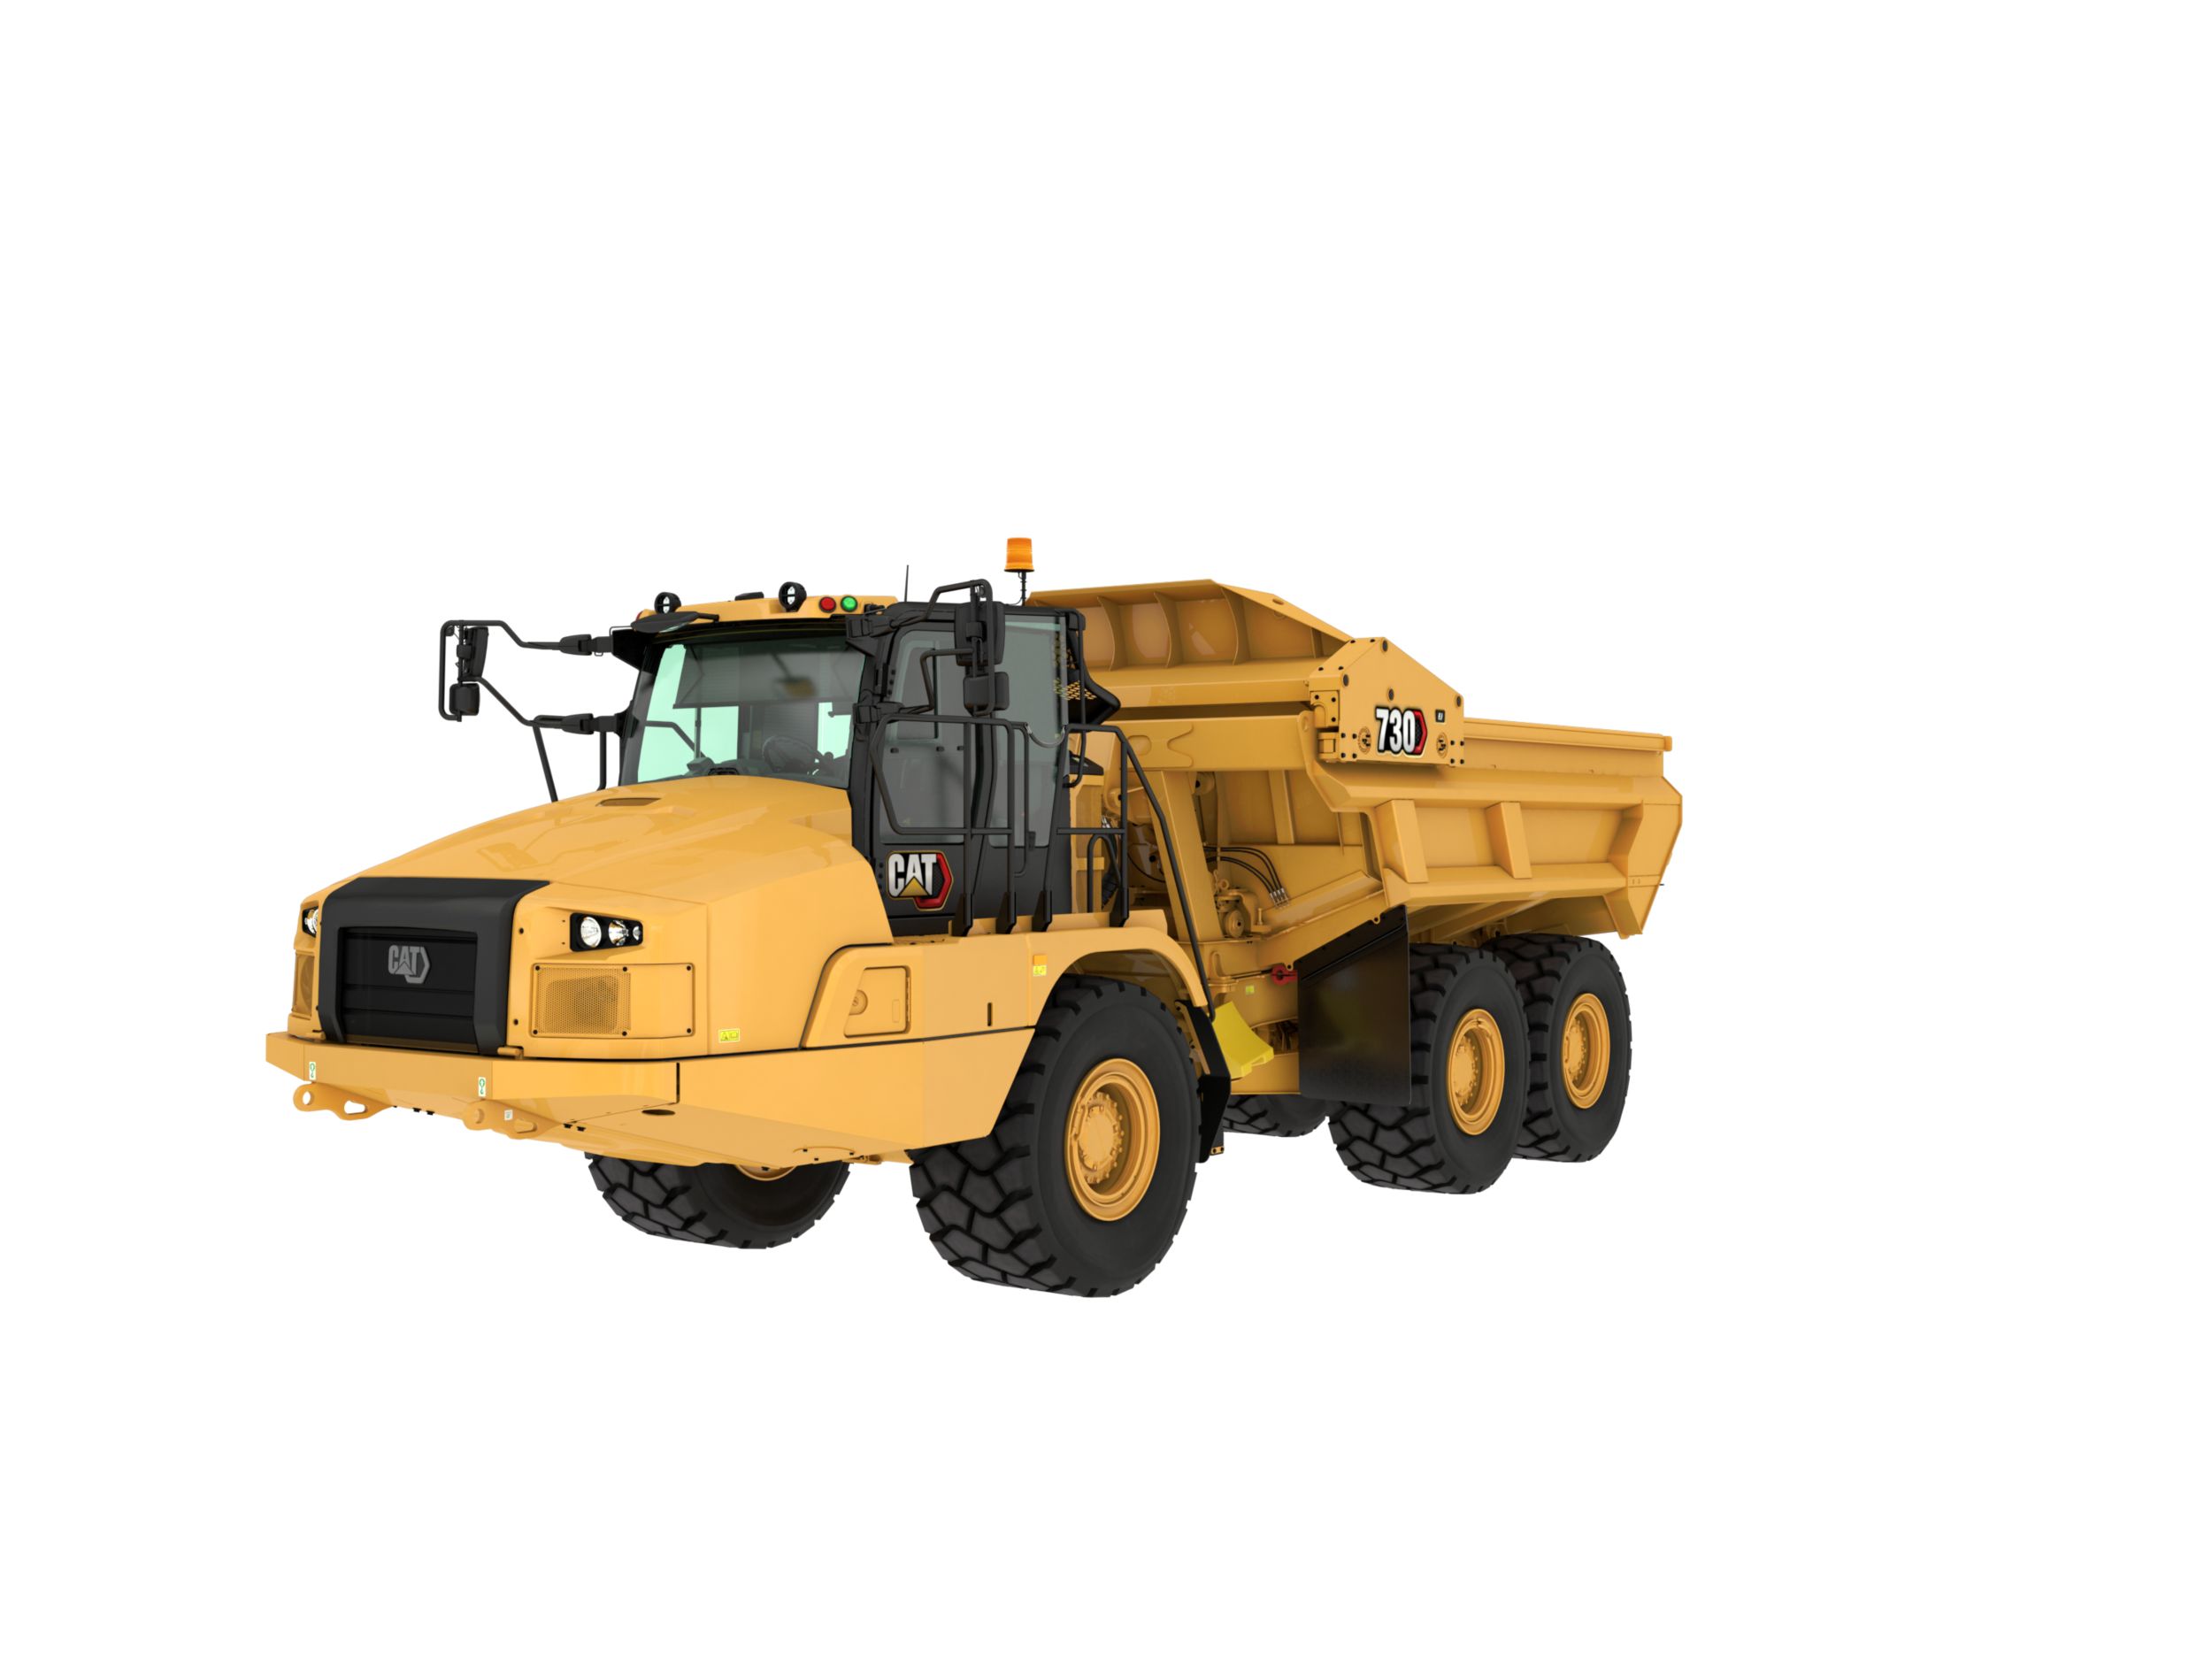
730 EJ
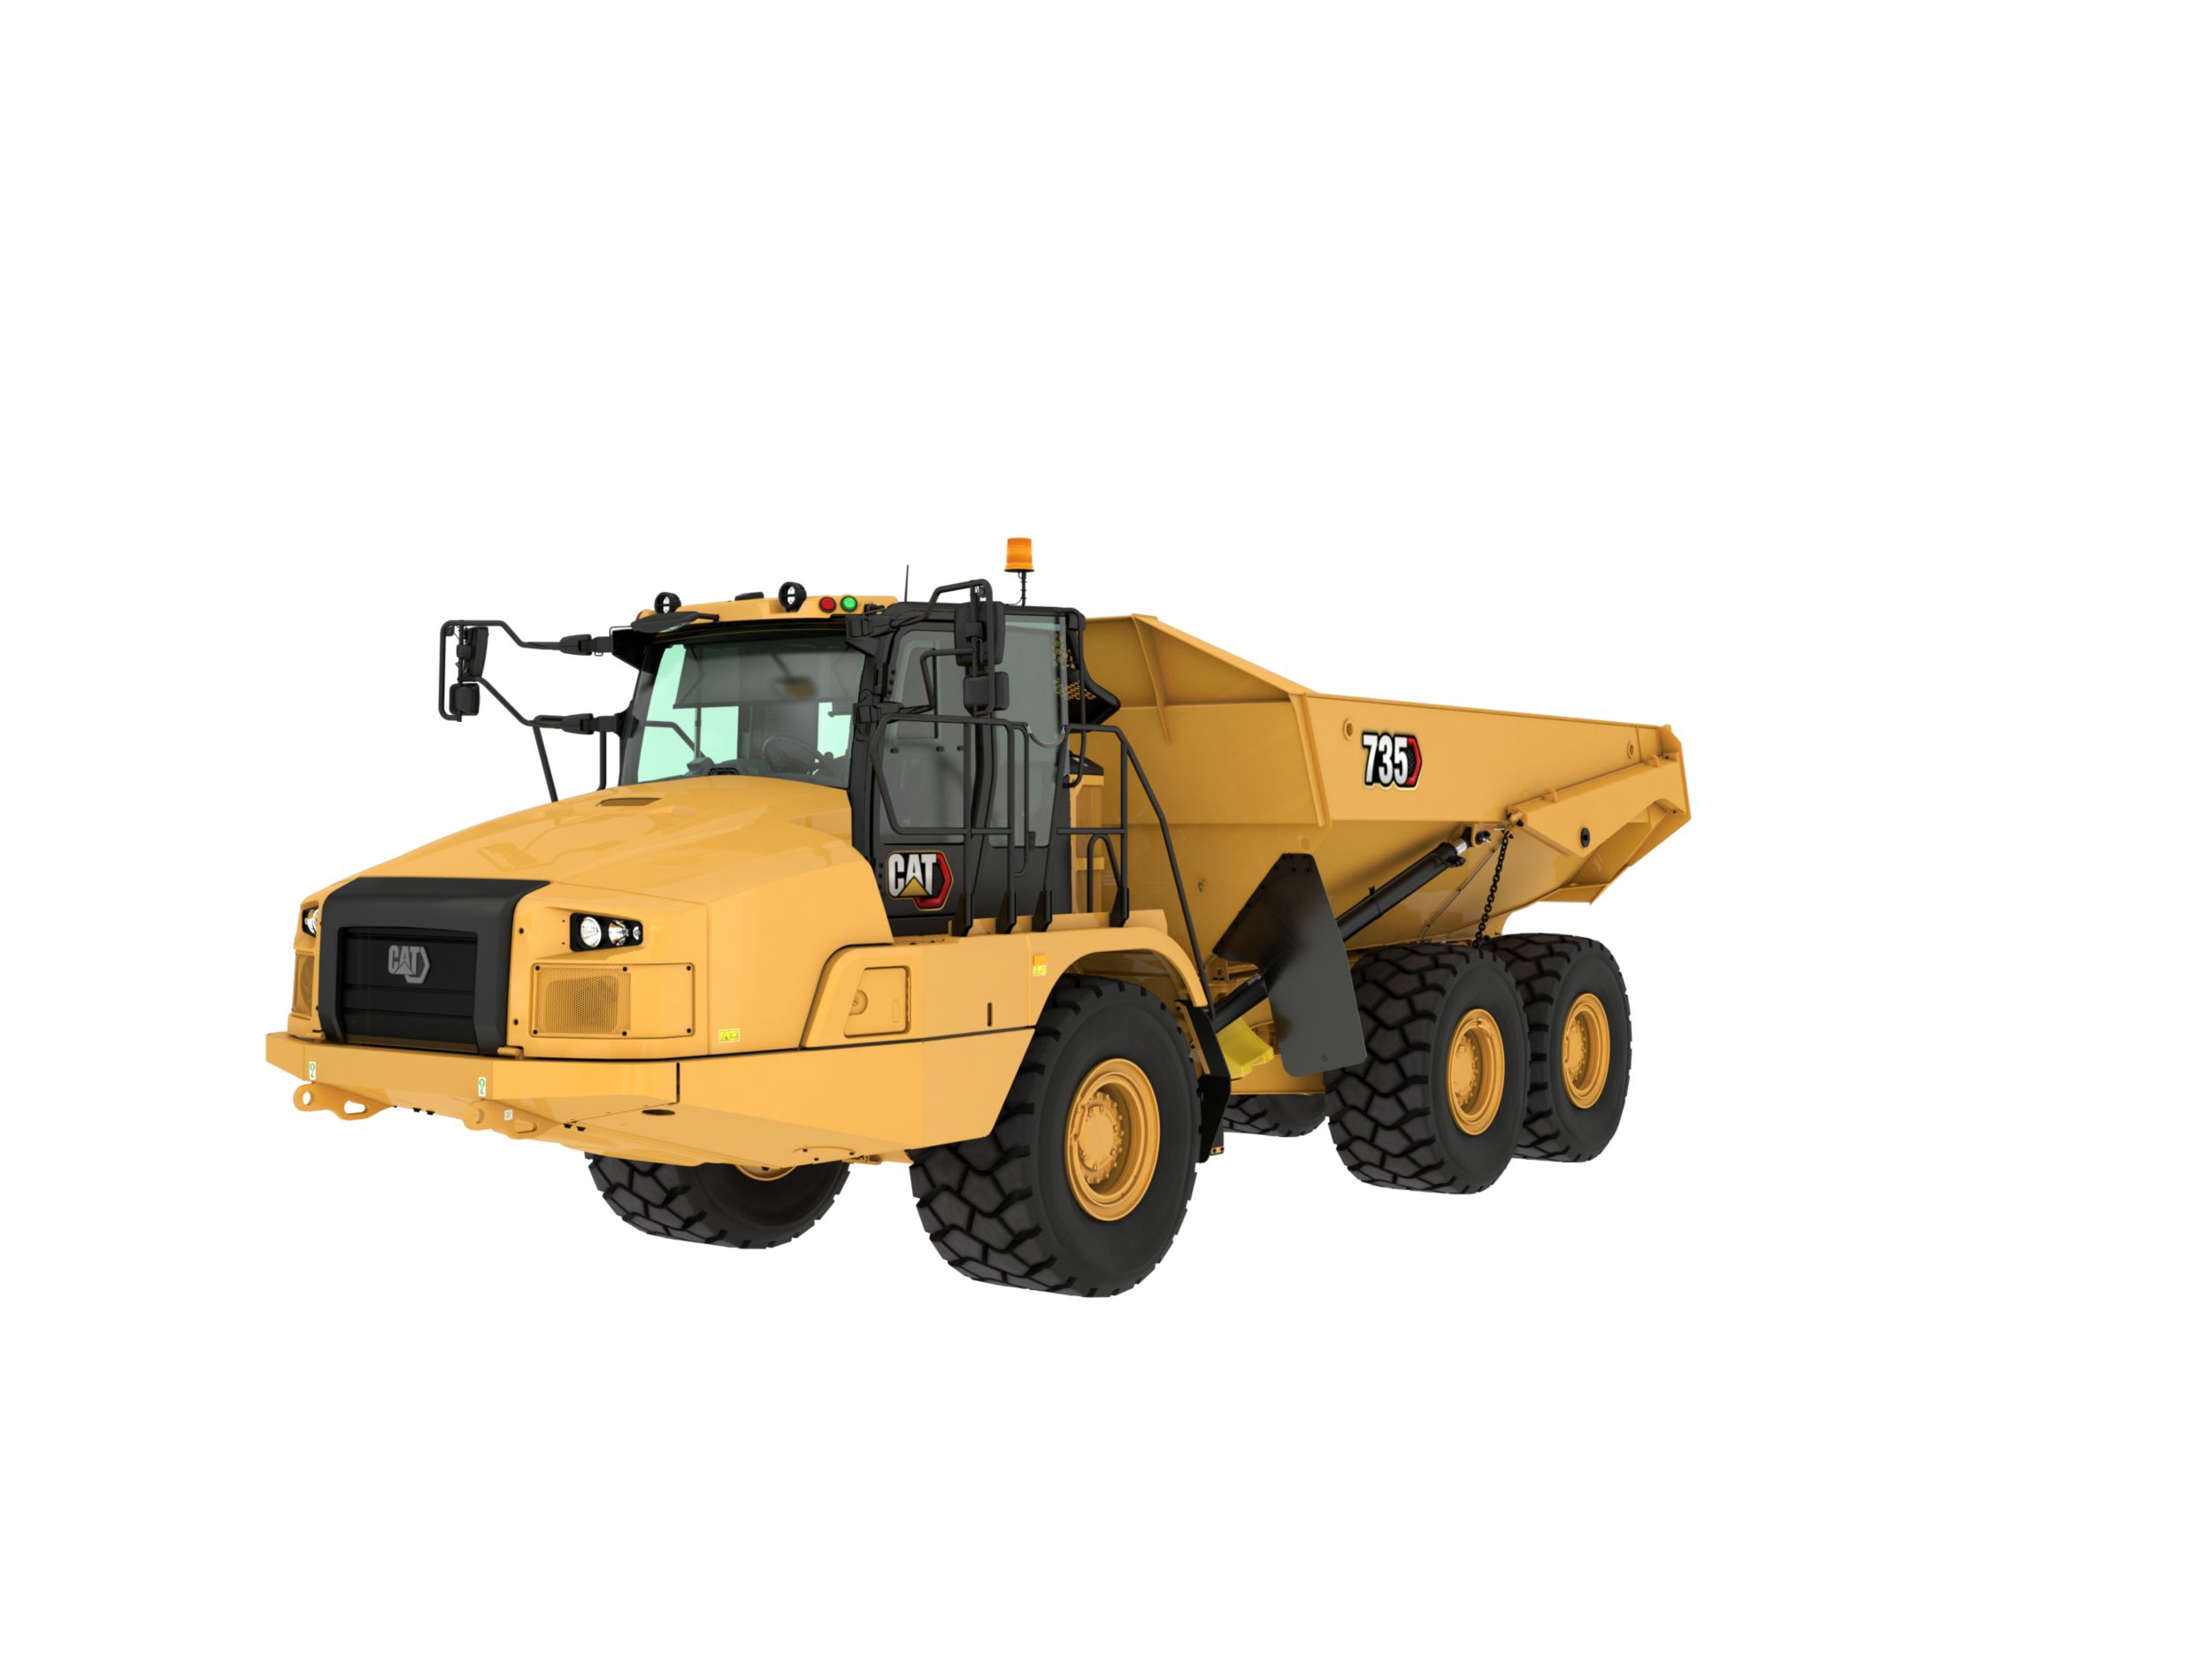
735
M322D2
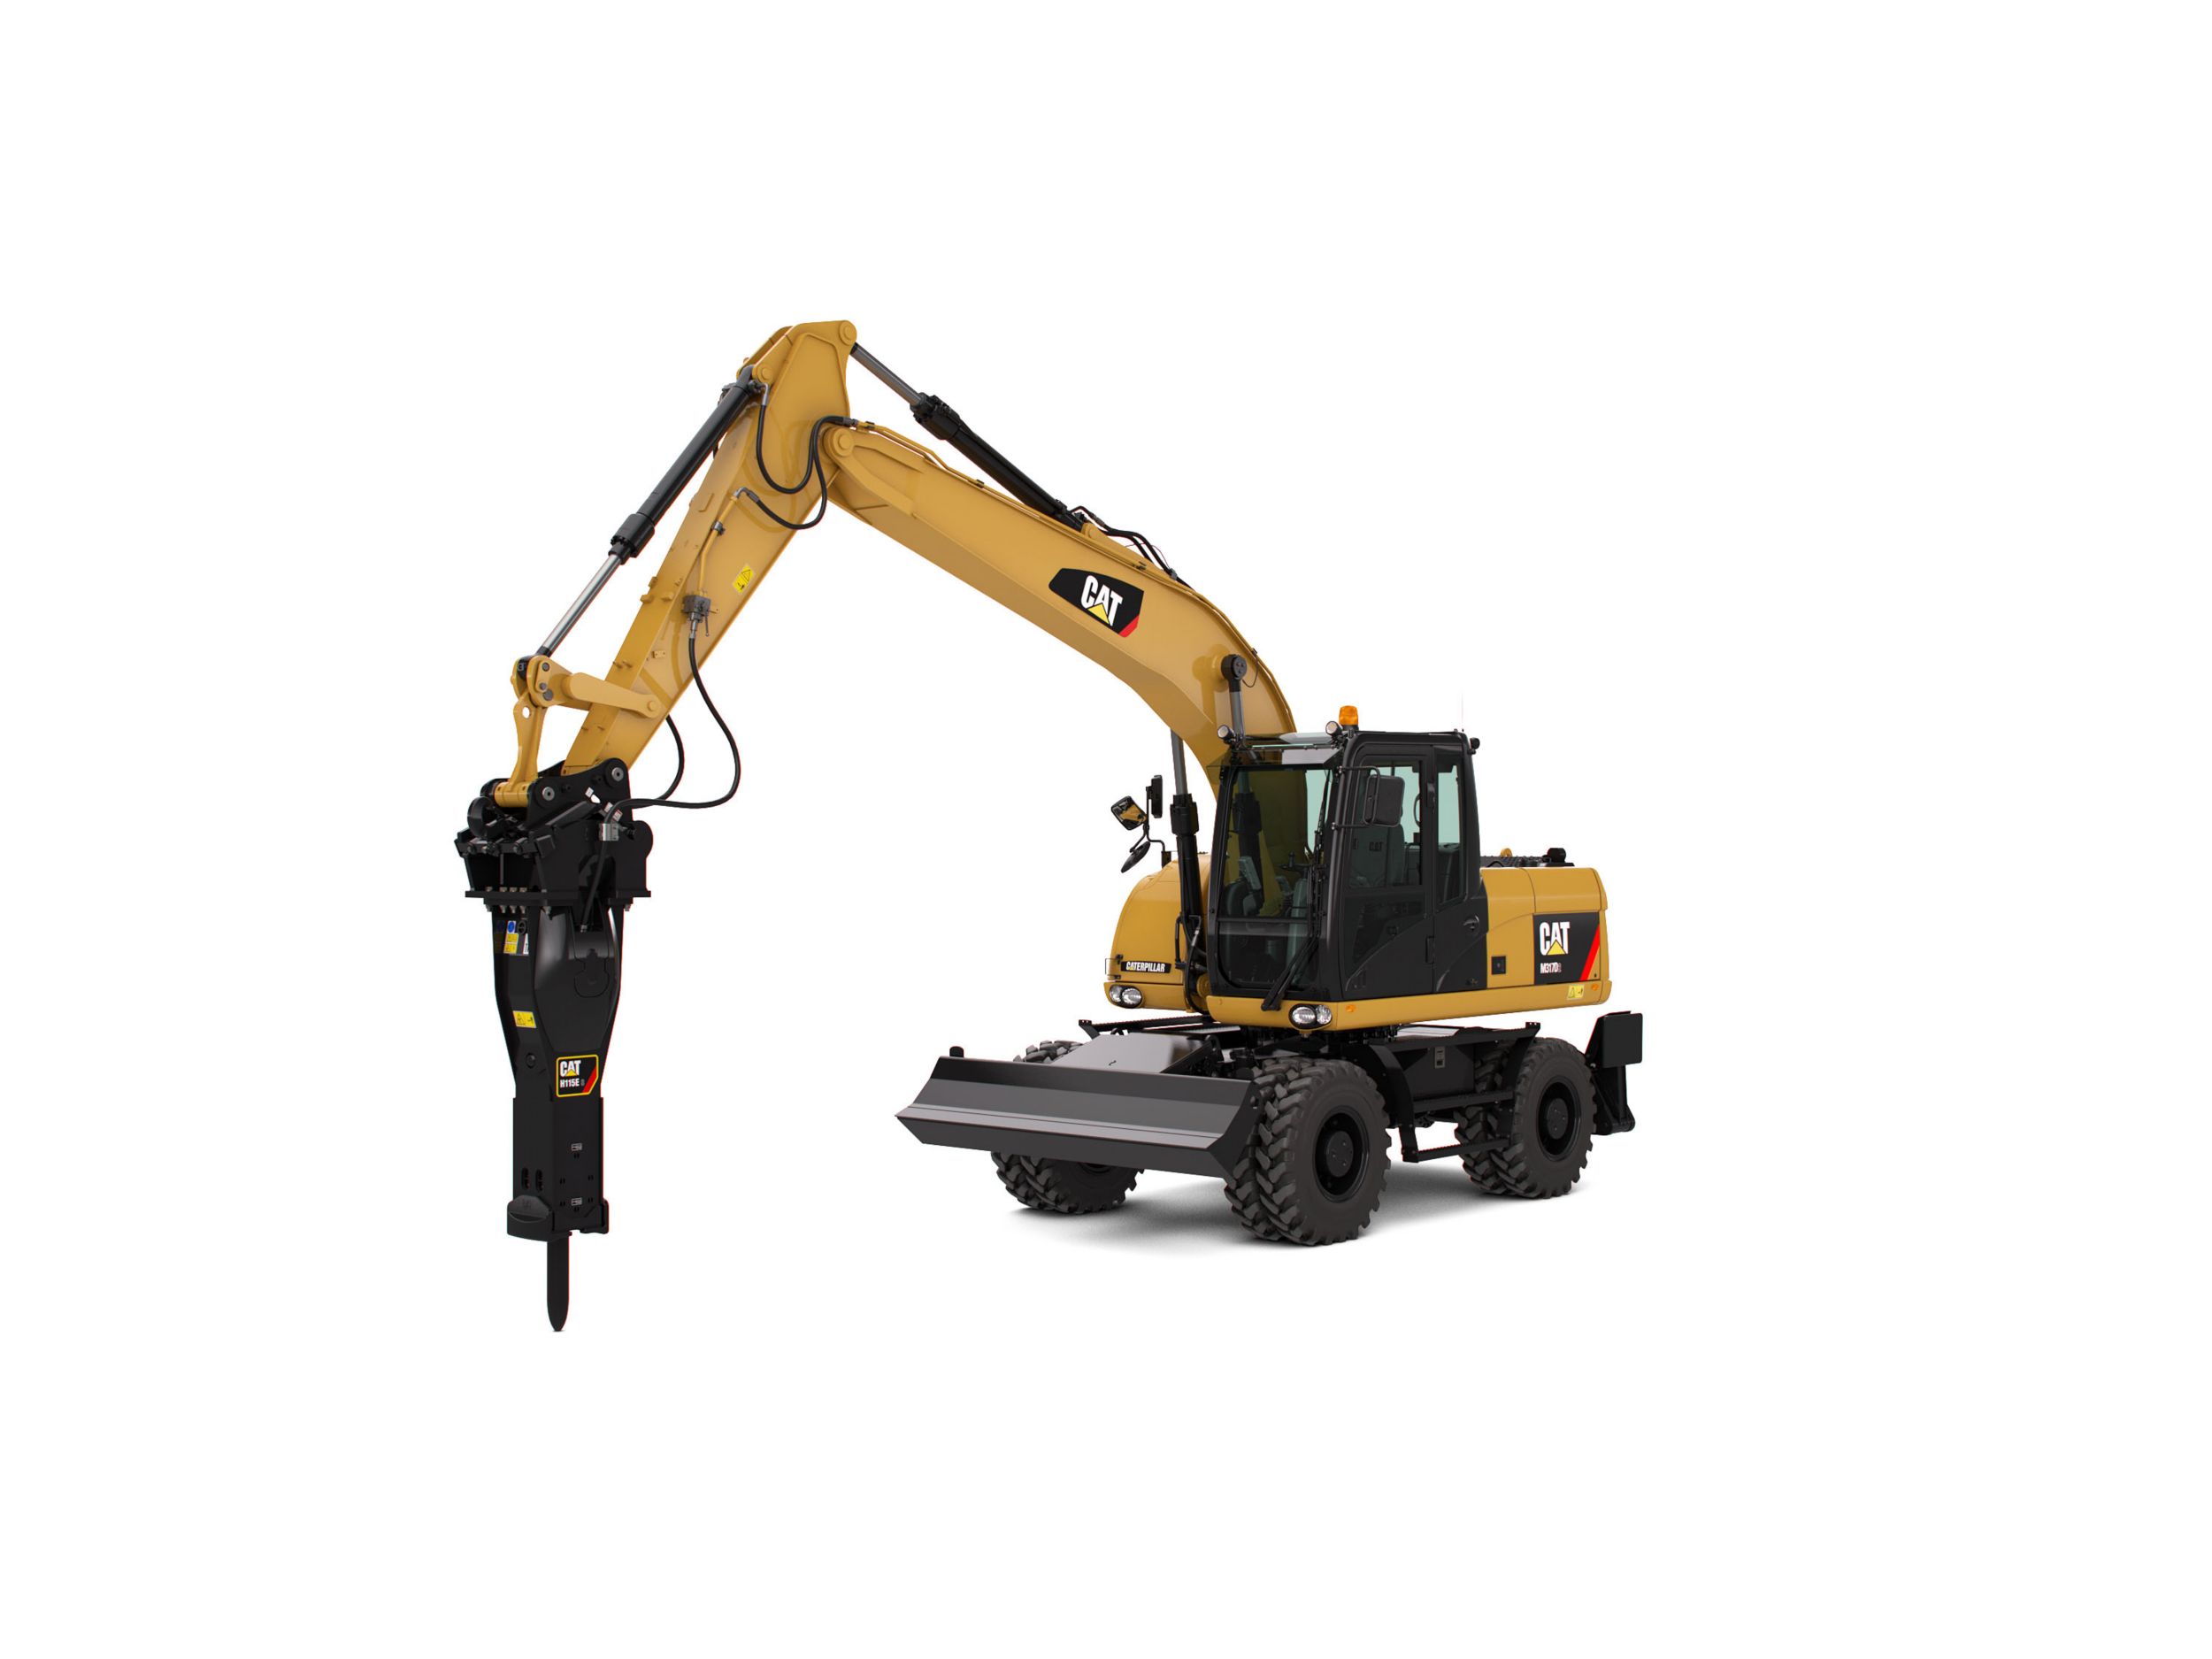
M317D2
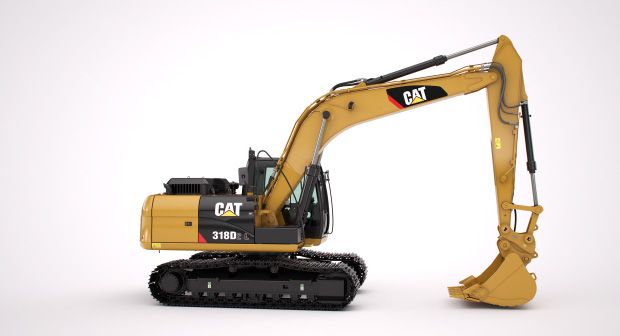
318D2 L (2017)
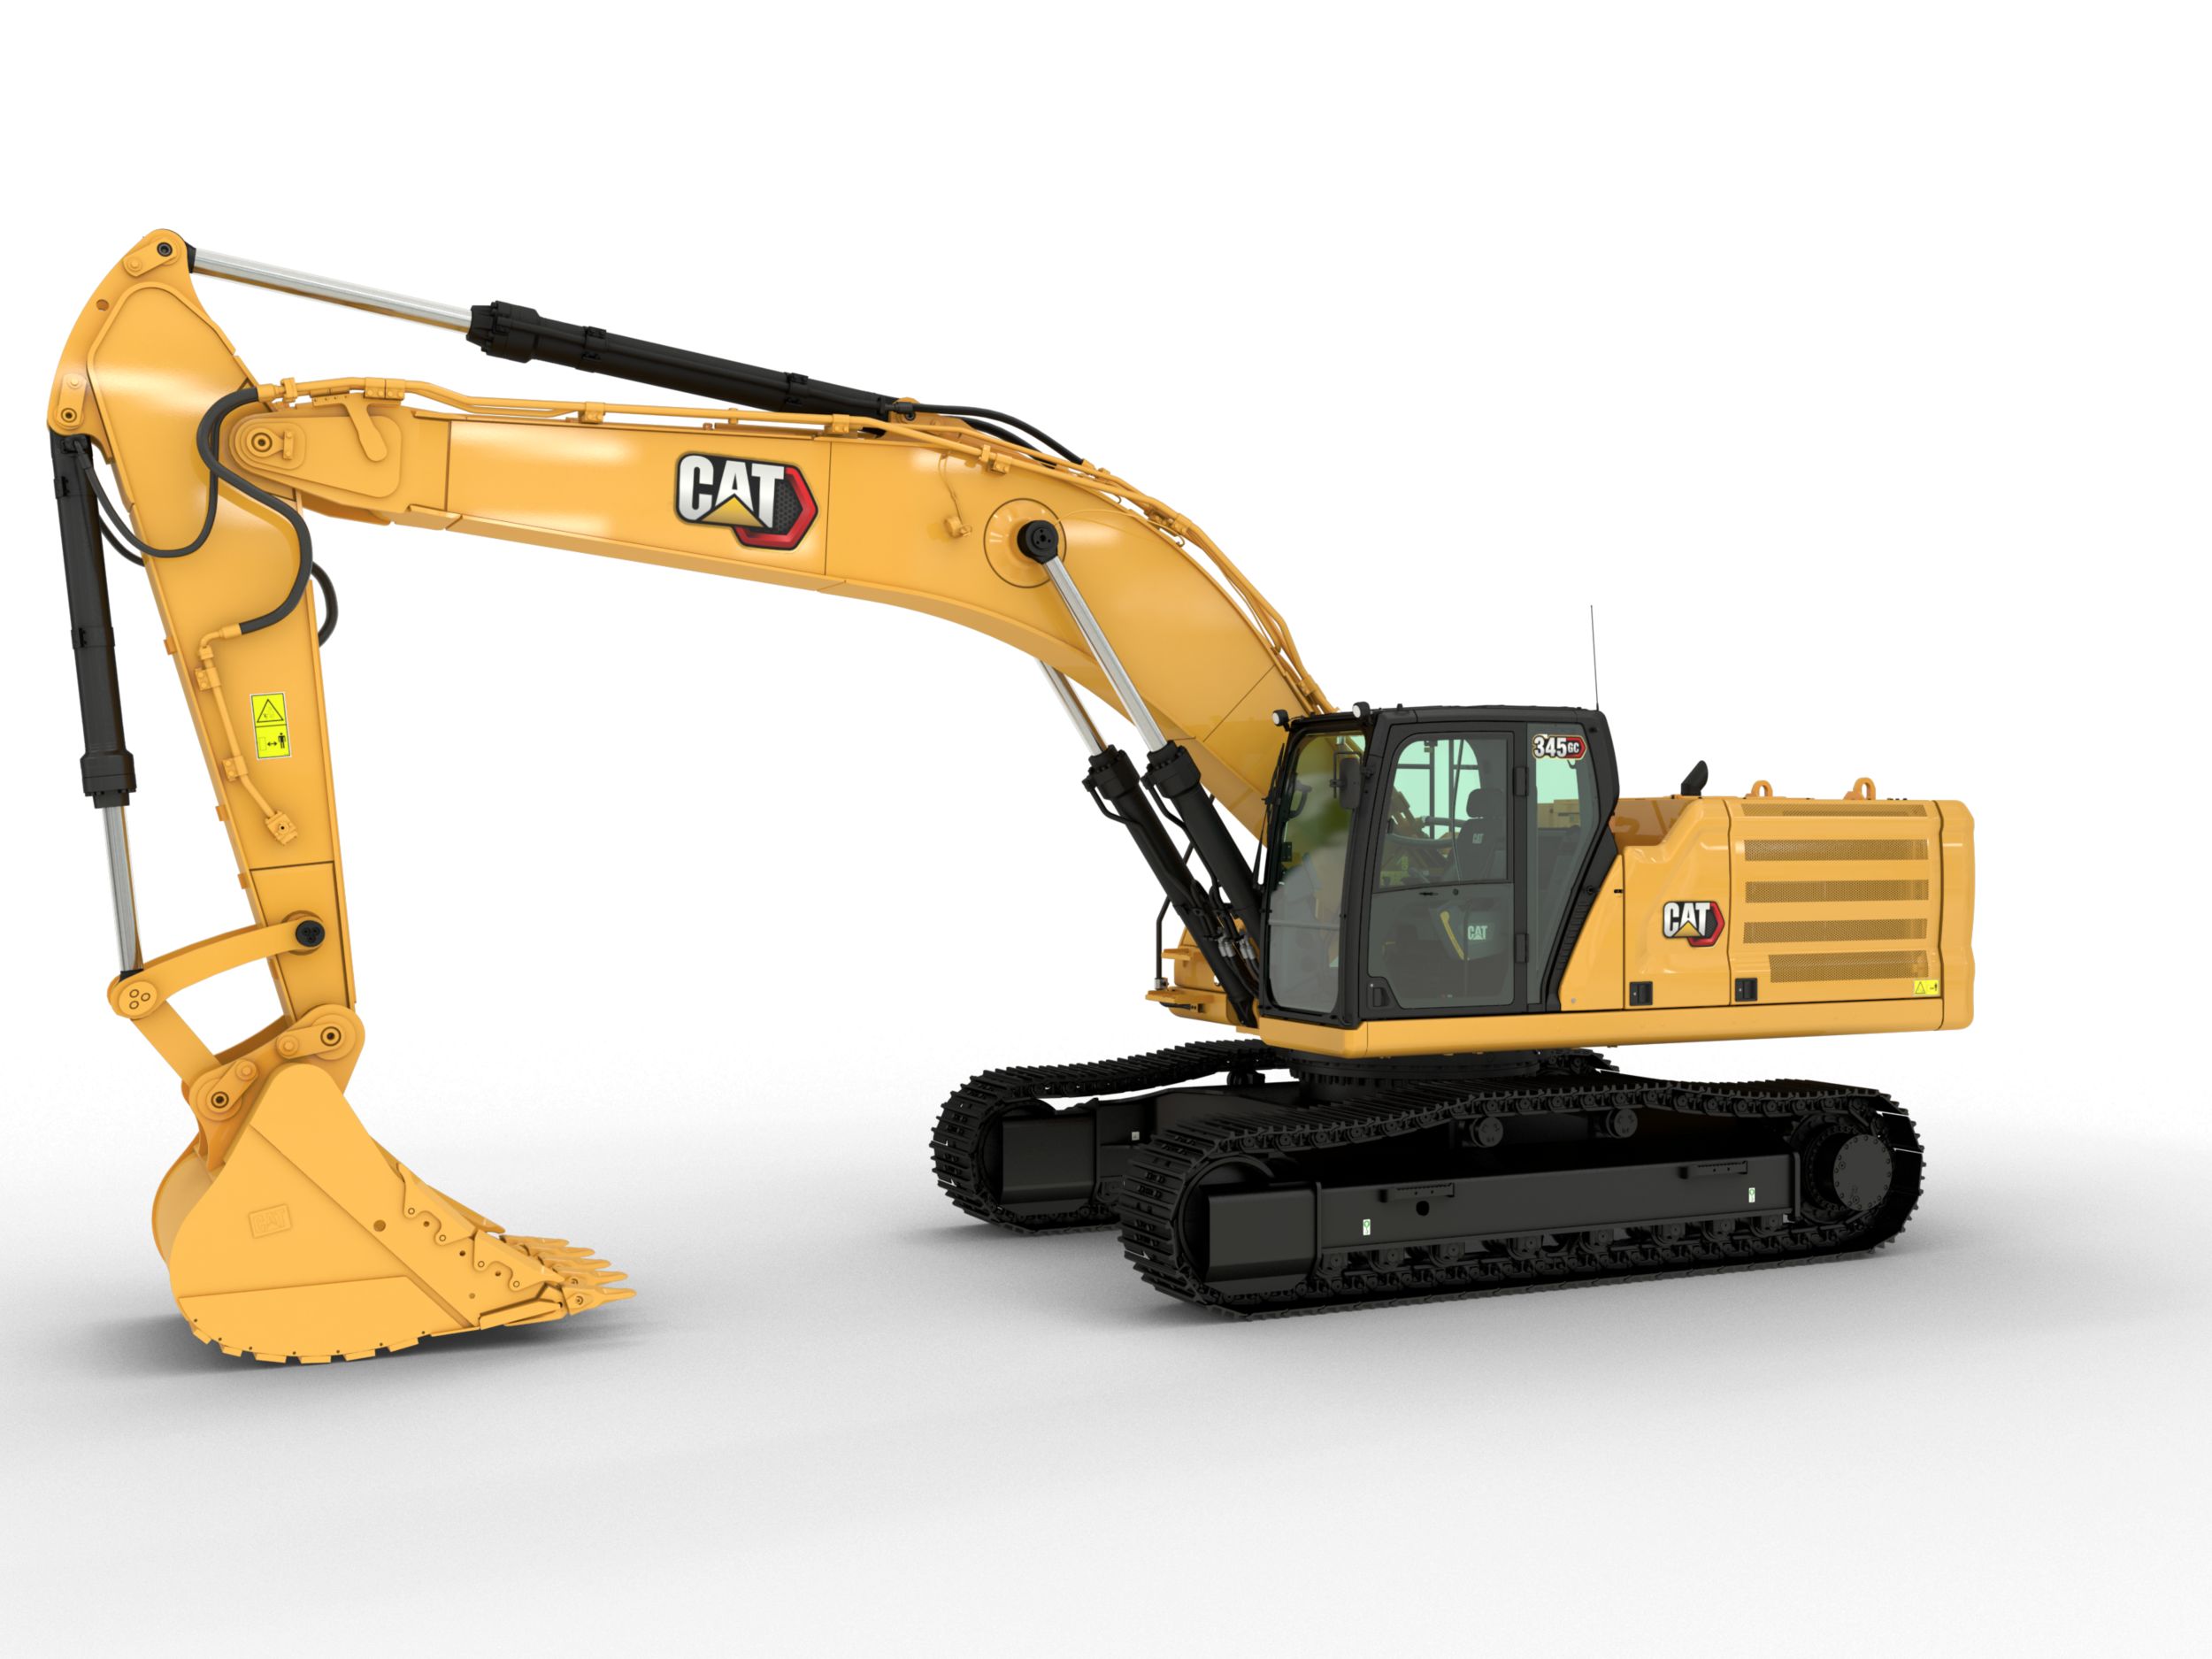
345 GC
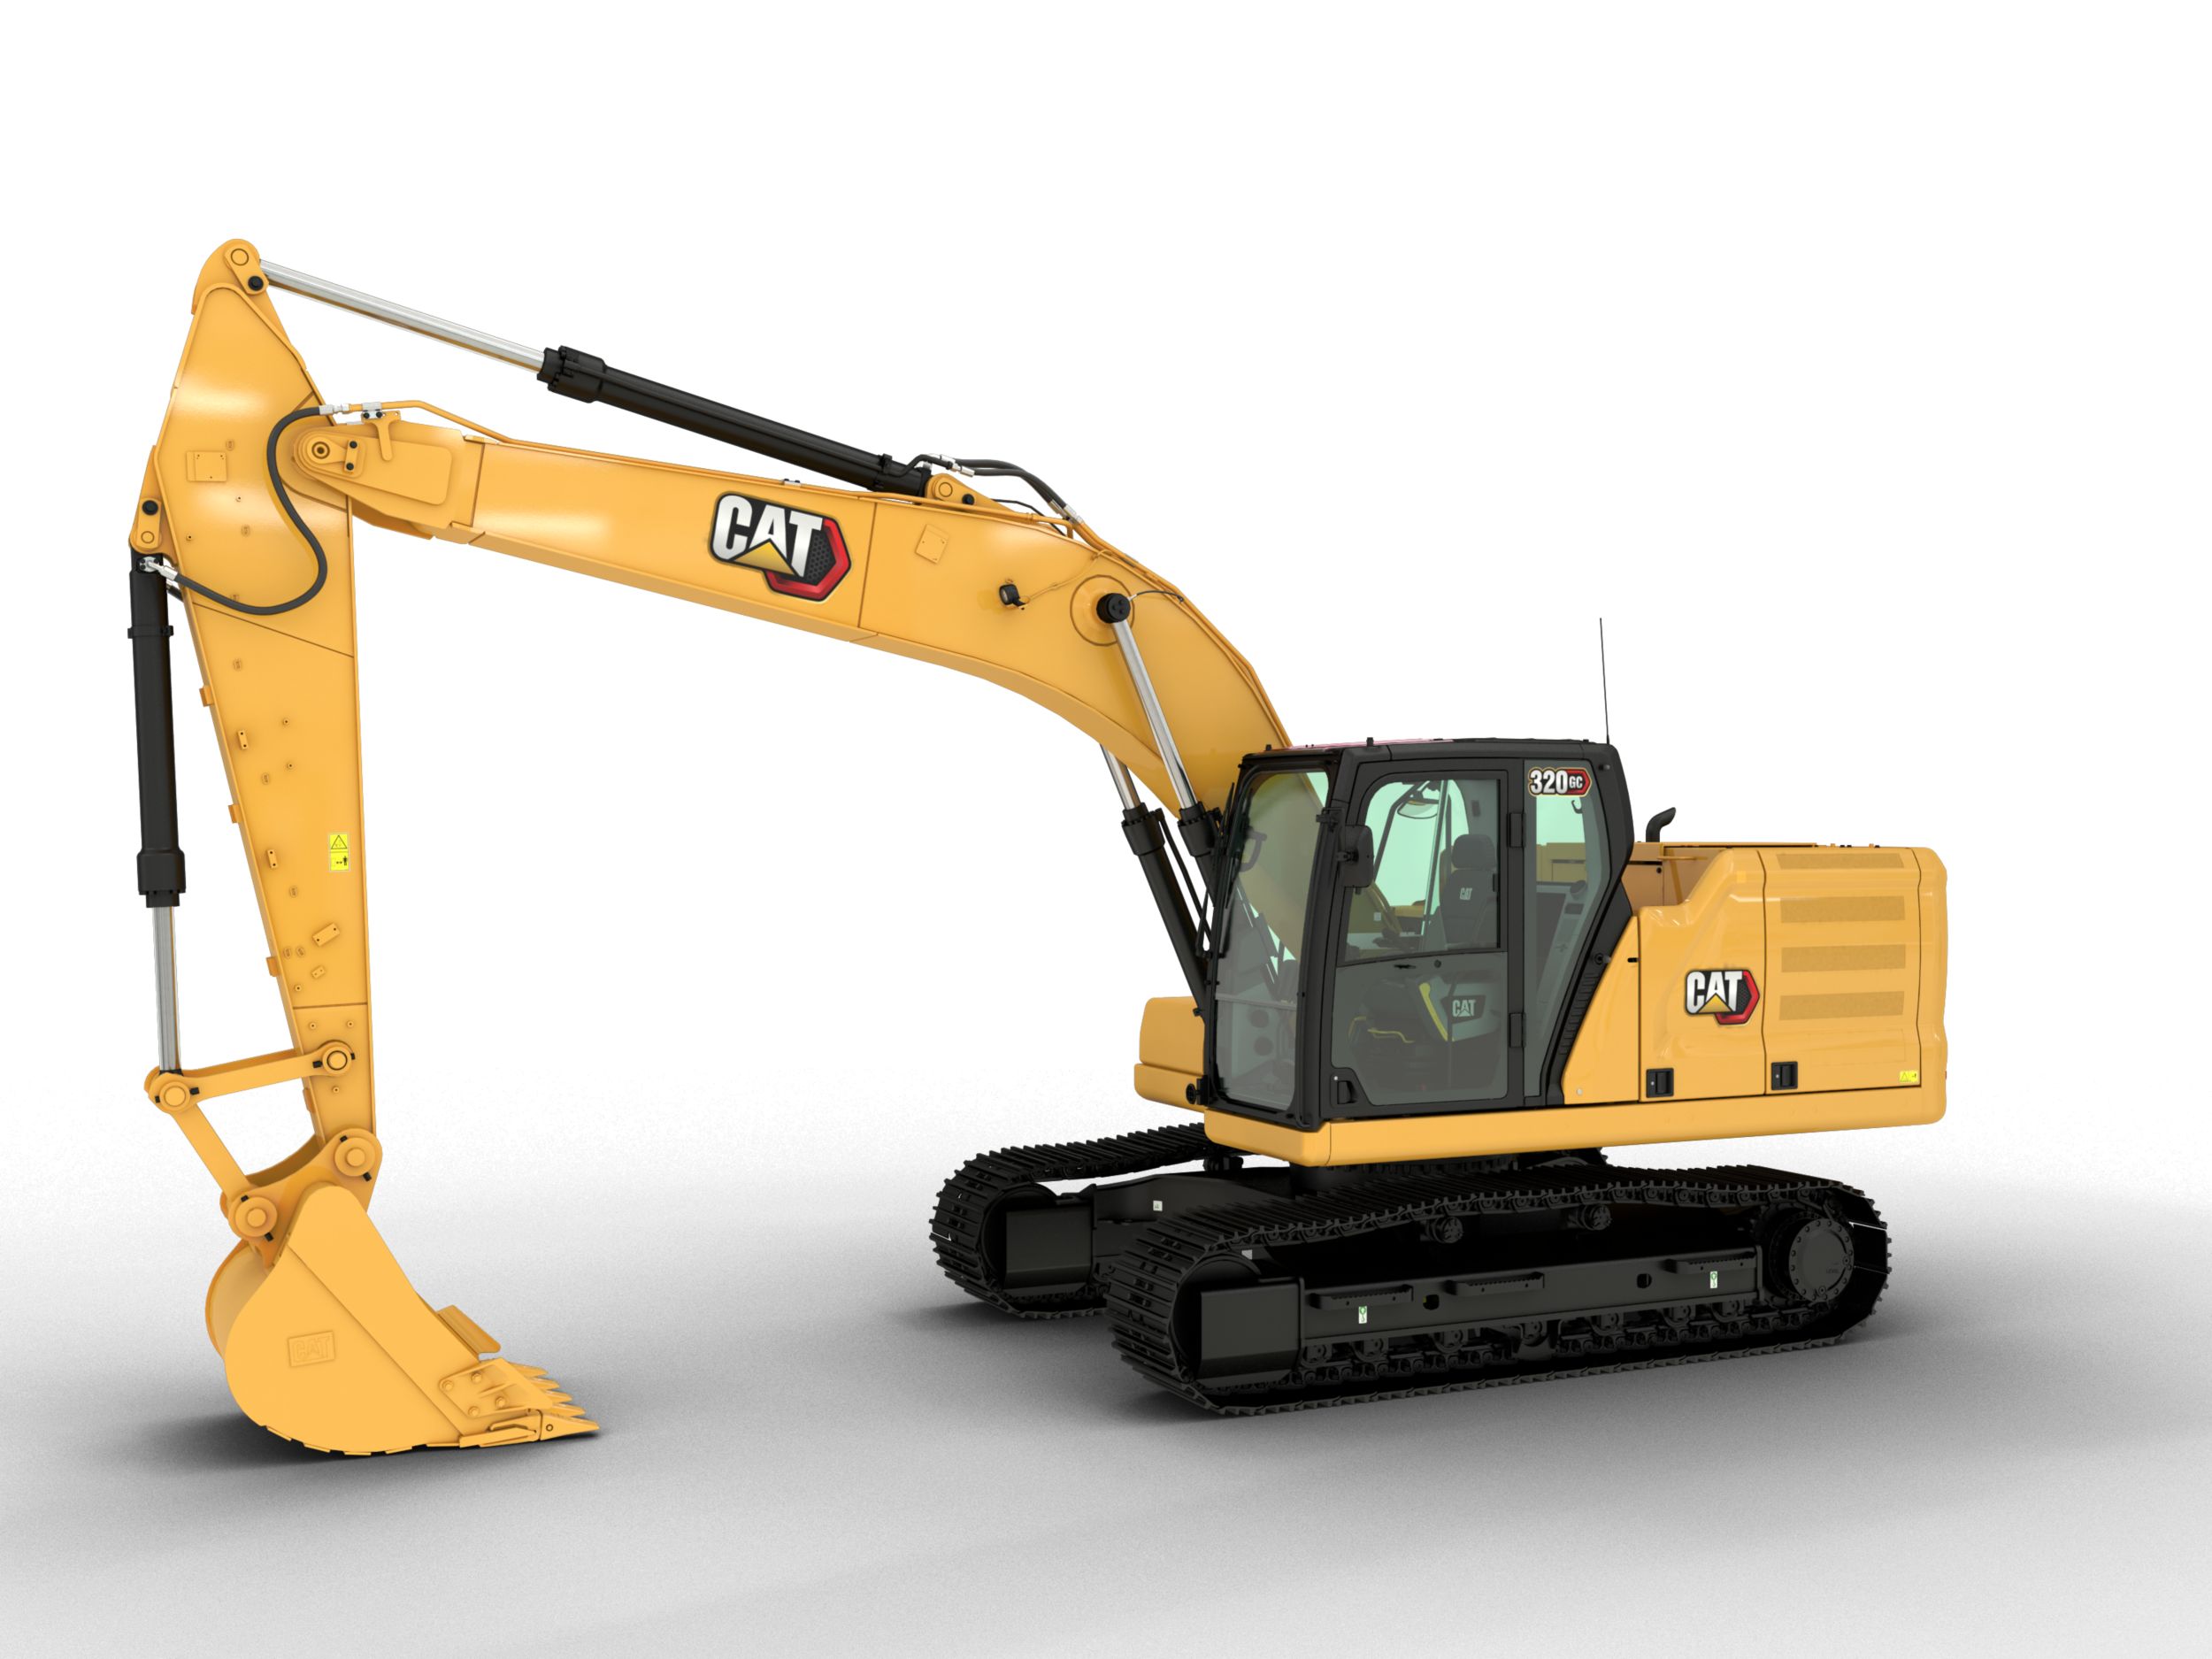
320 GC - Tier 3
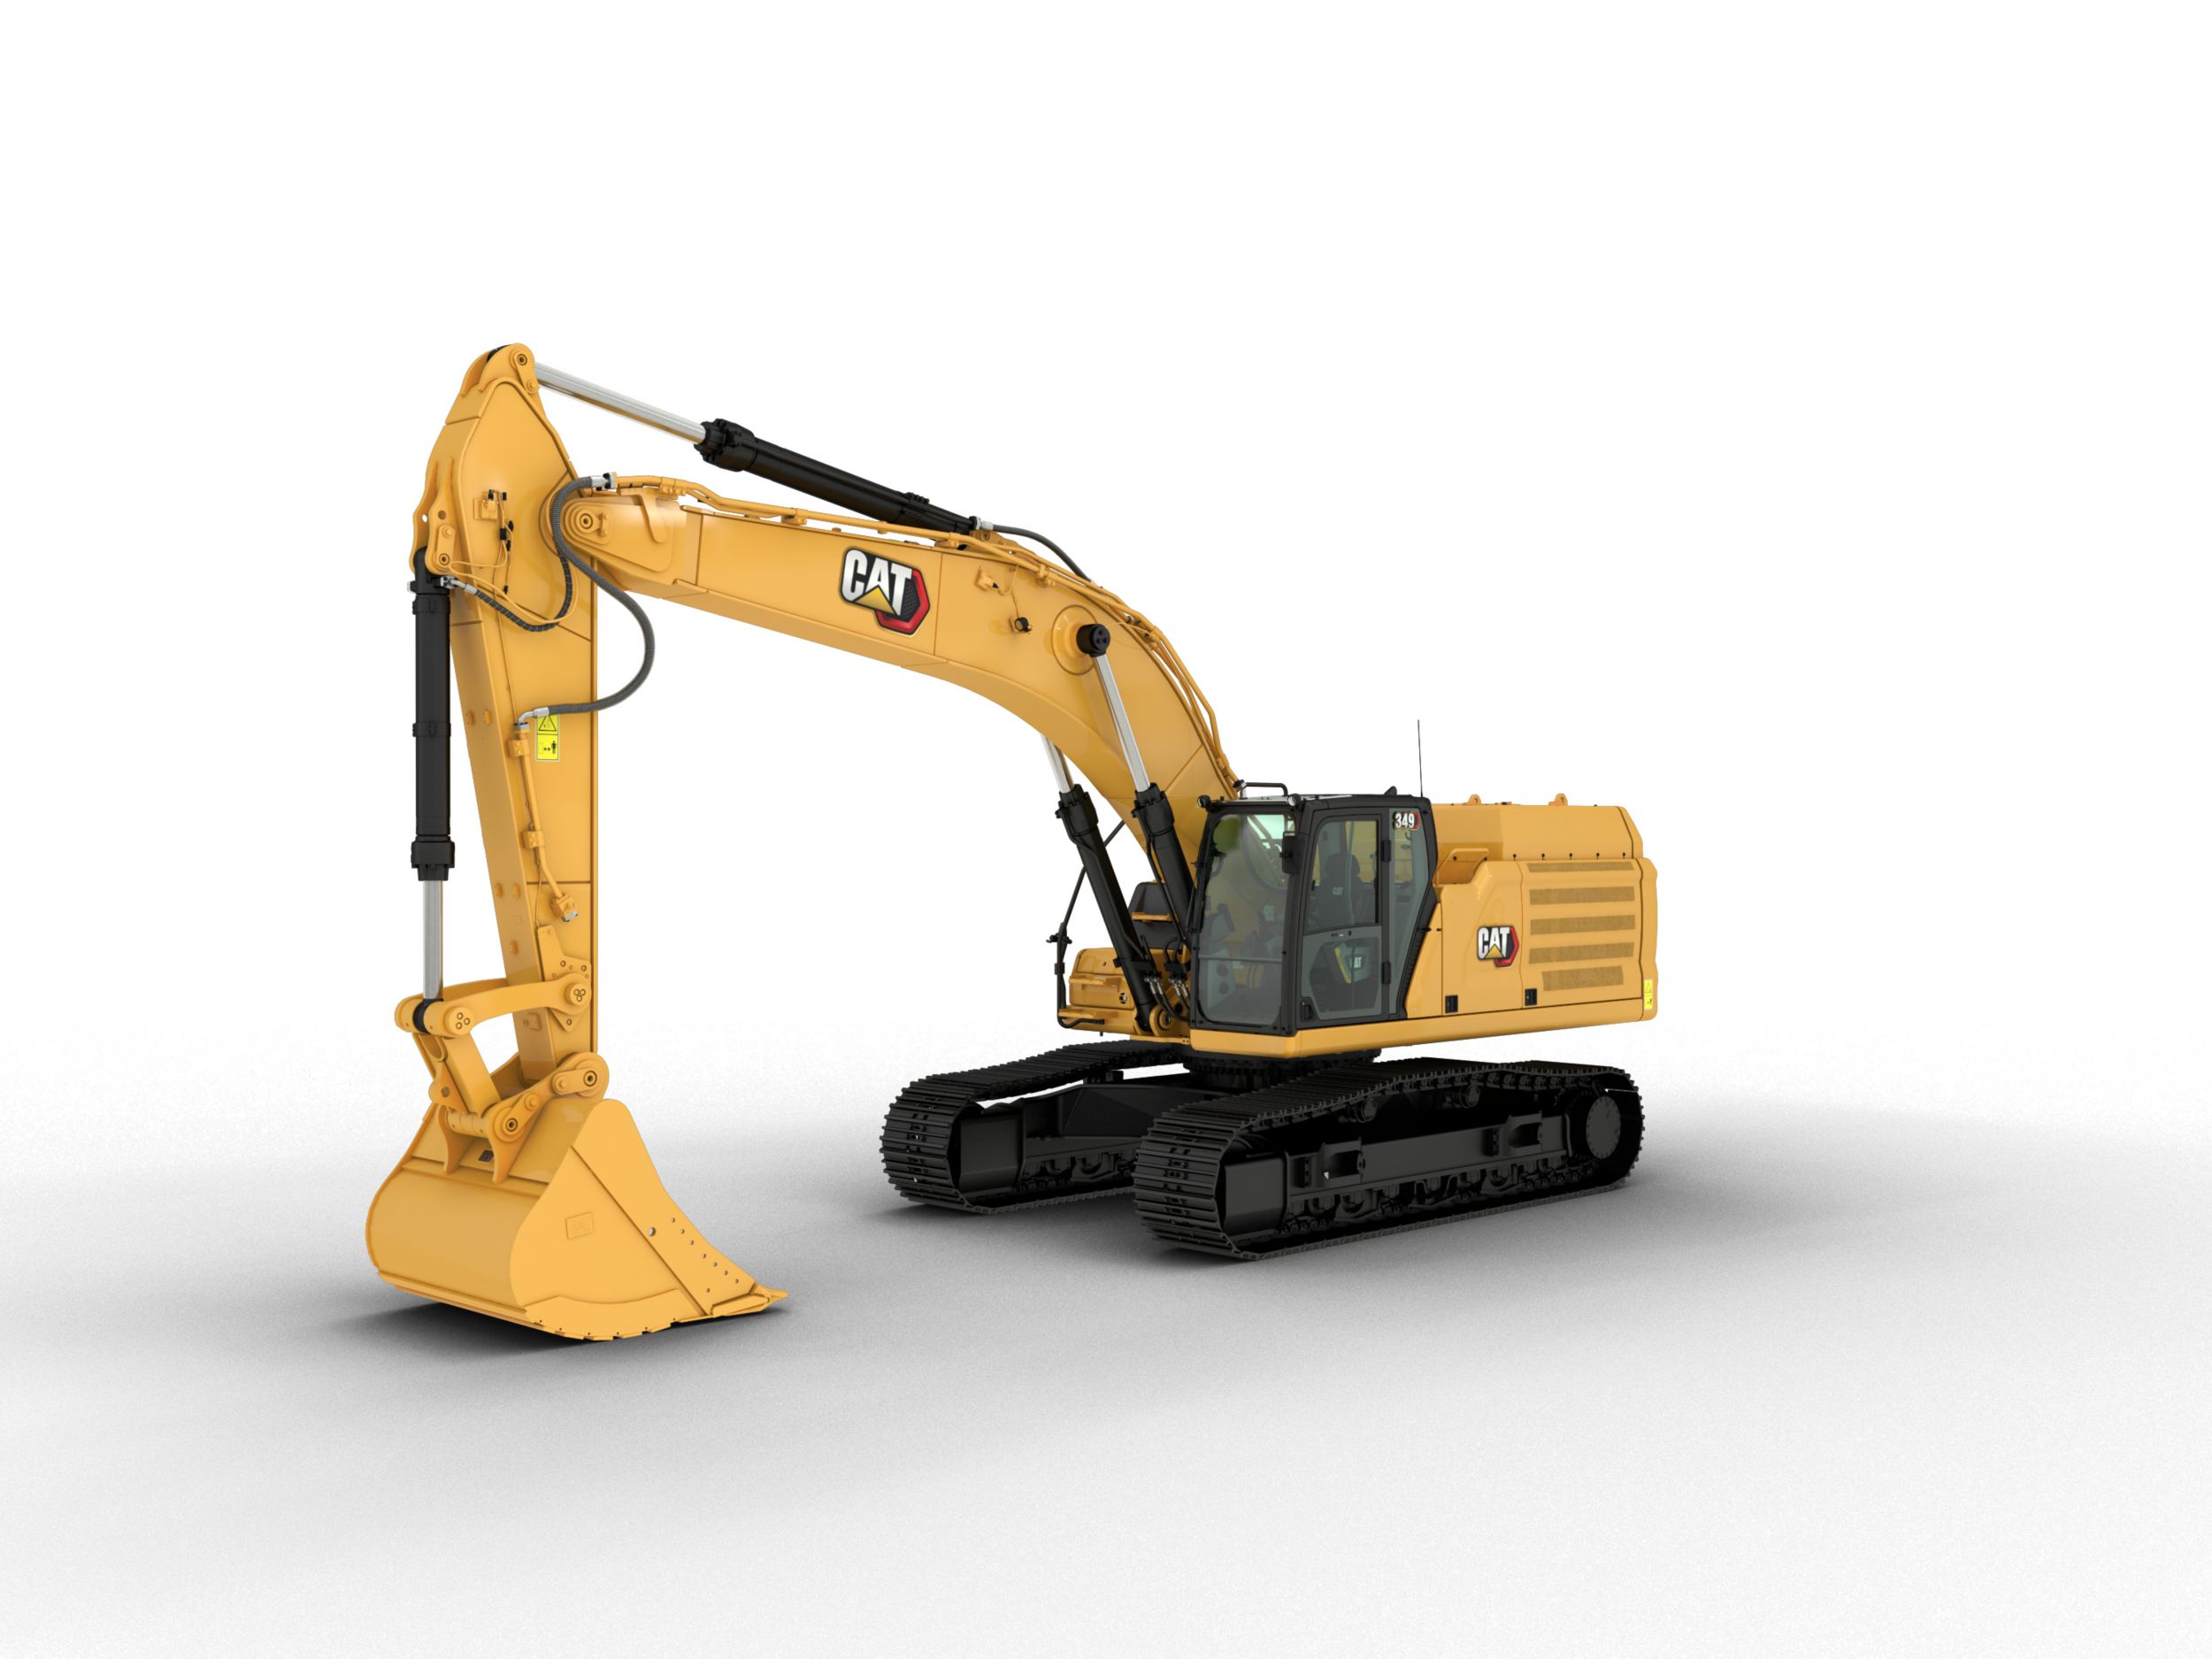
349

323 - Tier 3
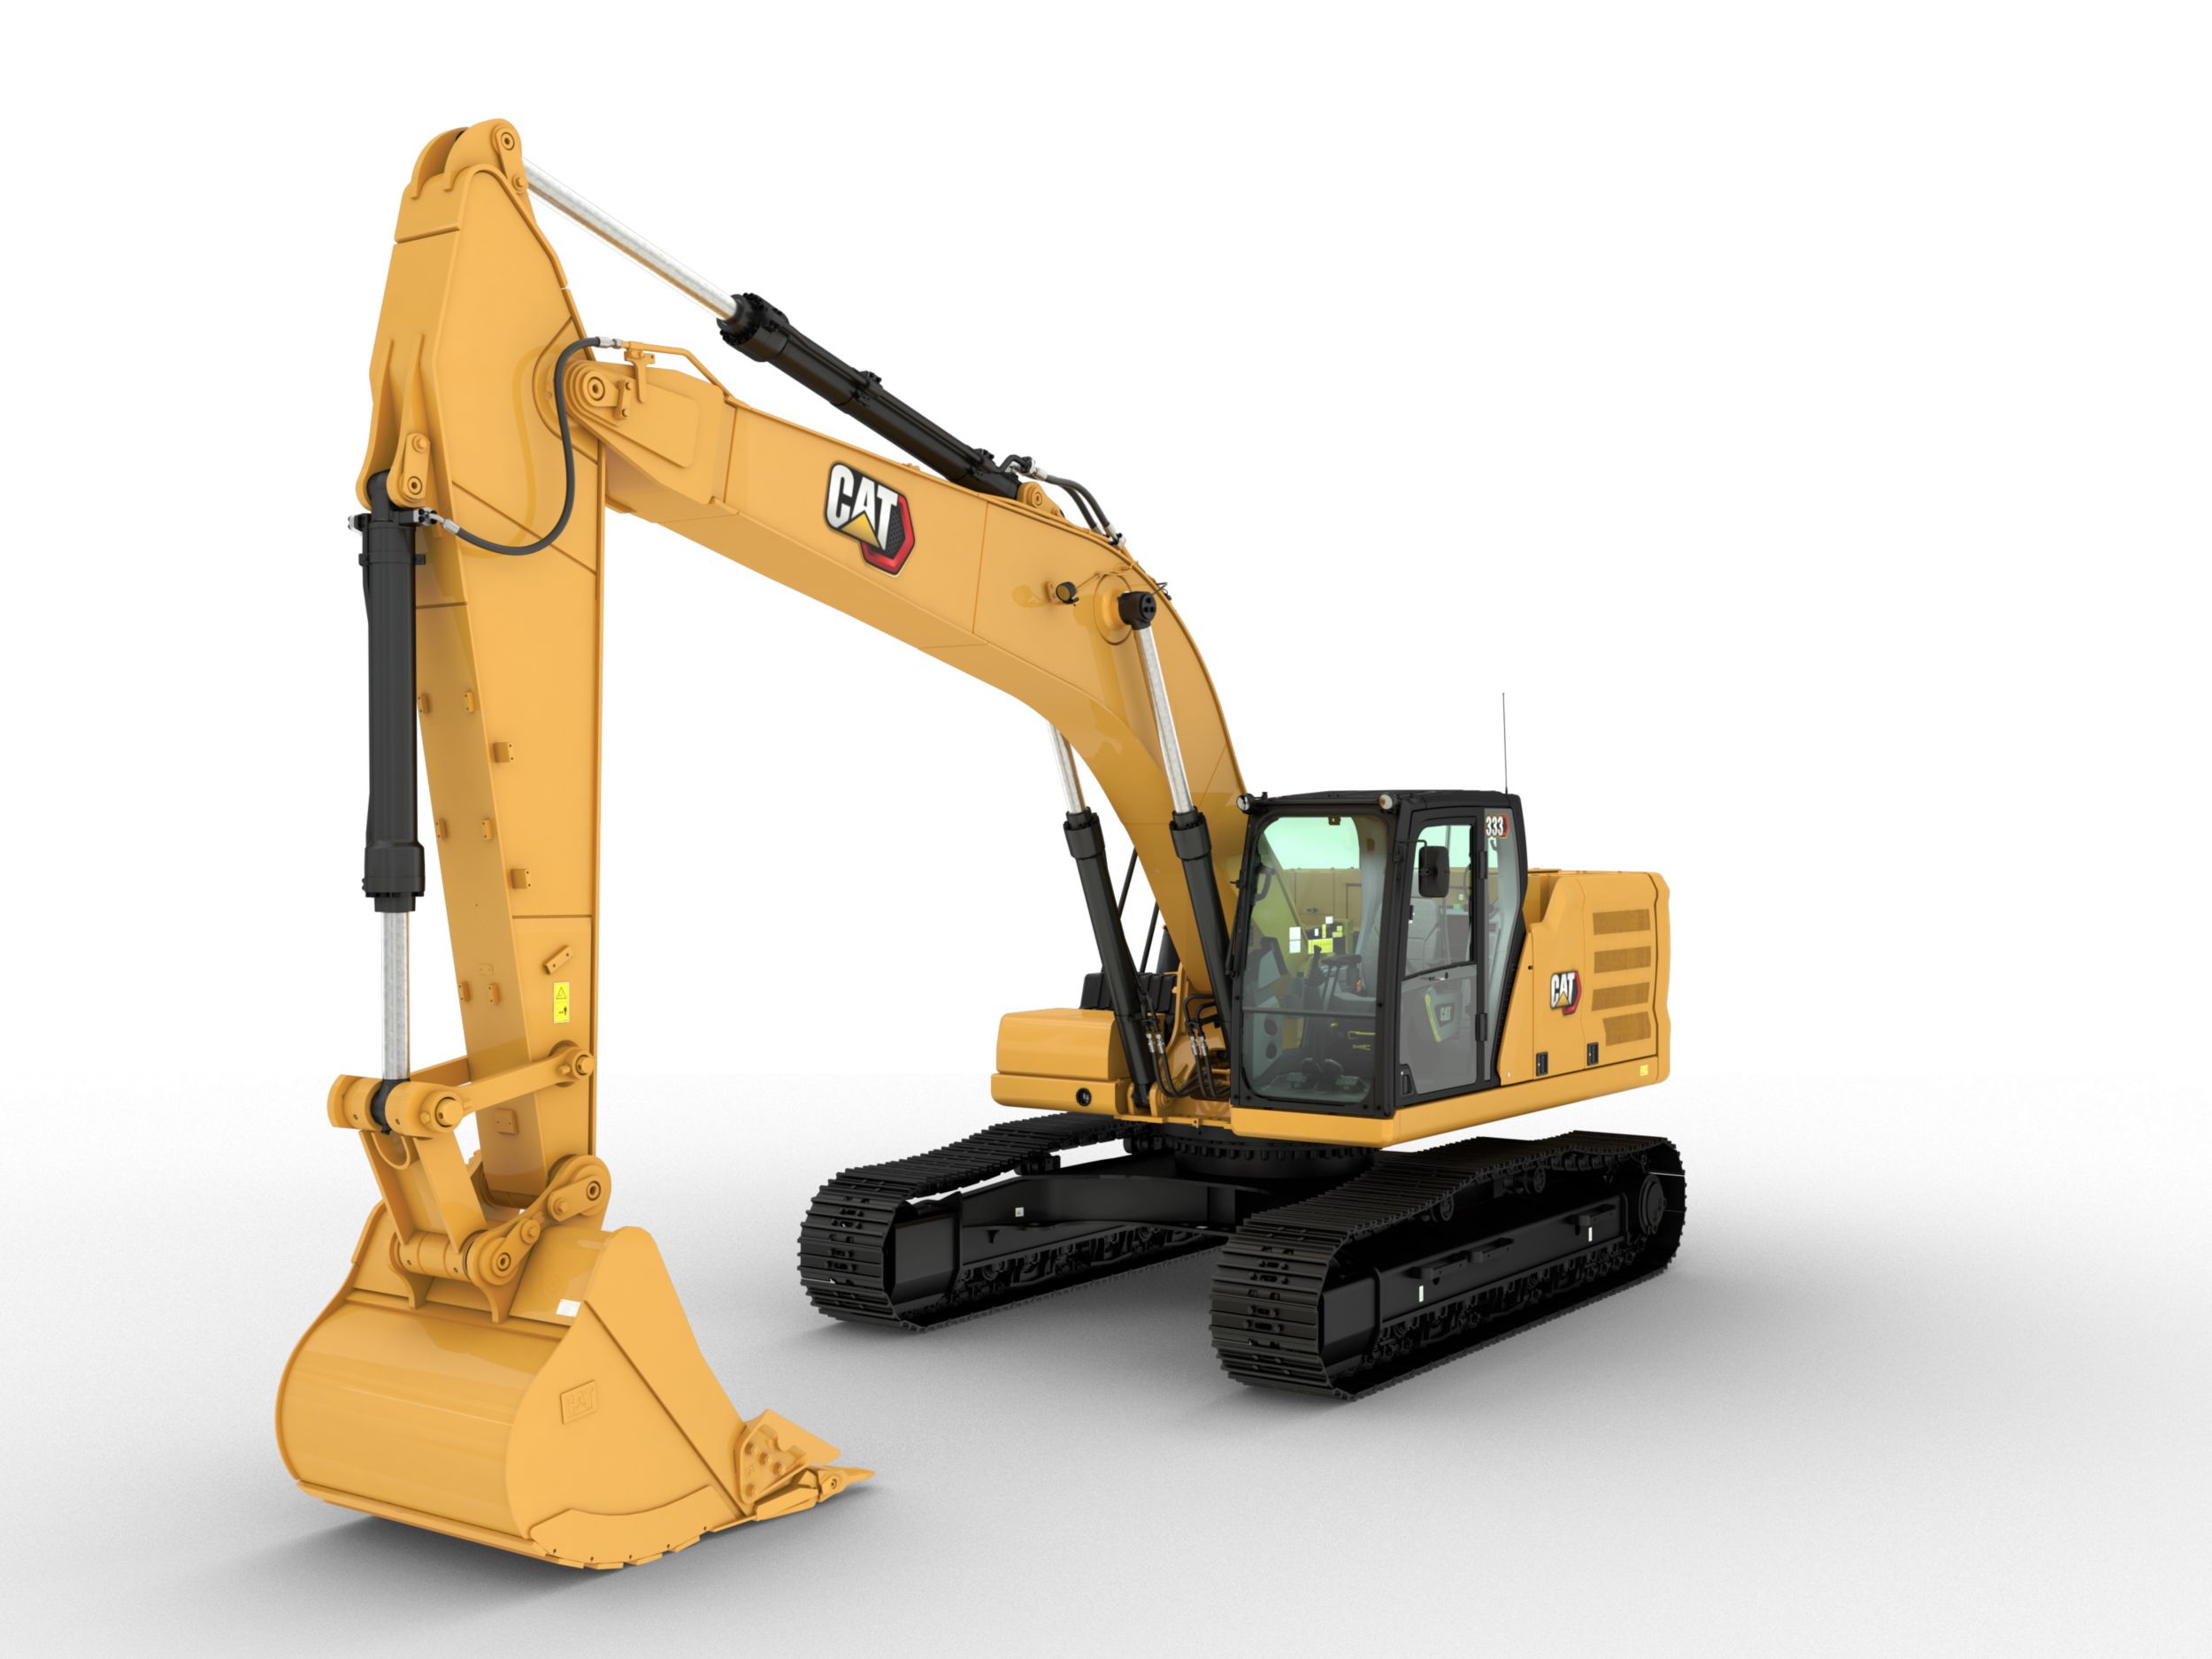
333 - Tier 3
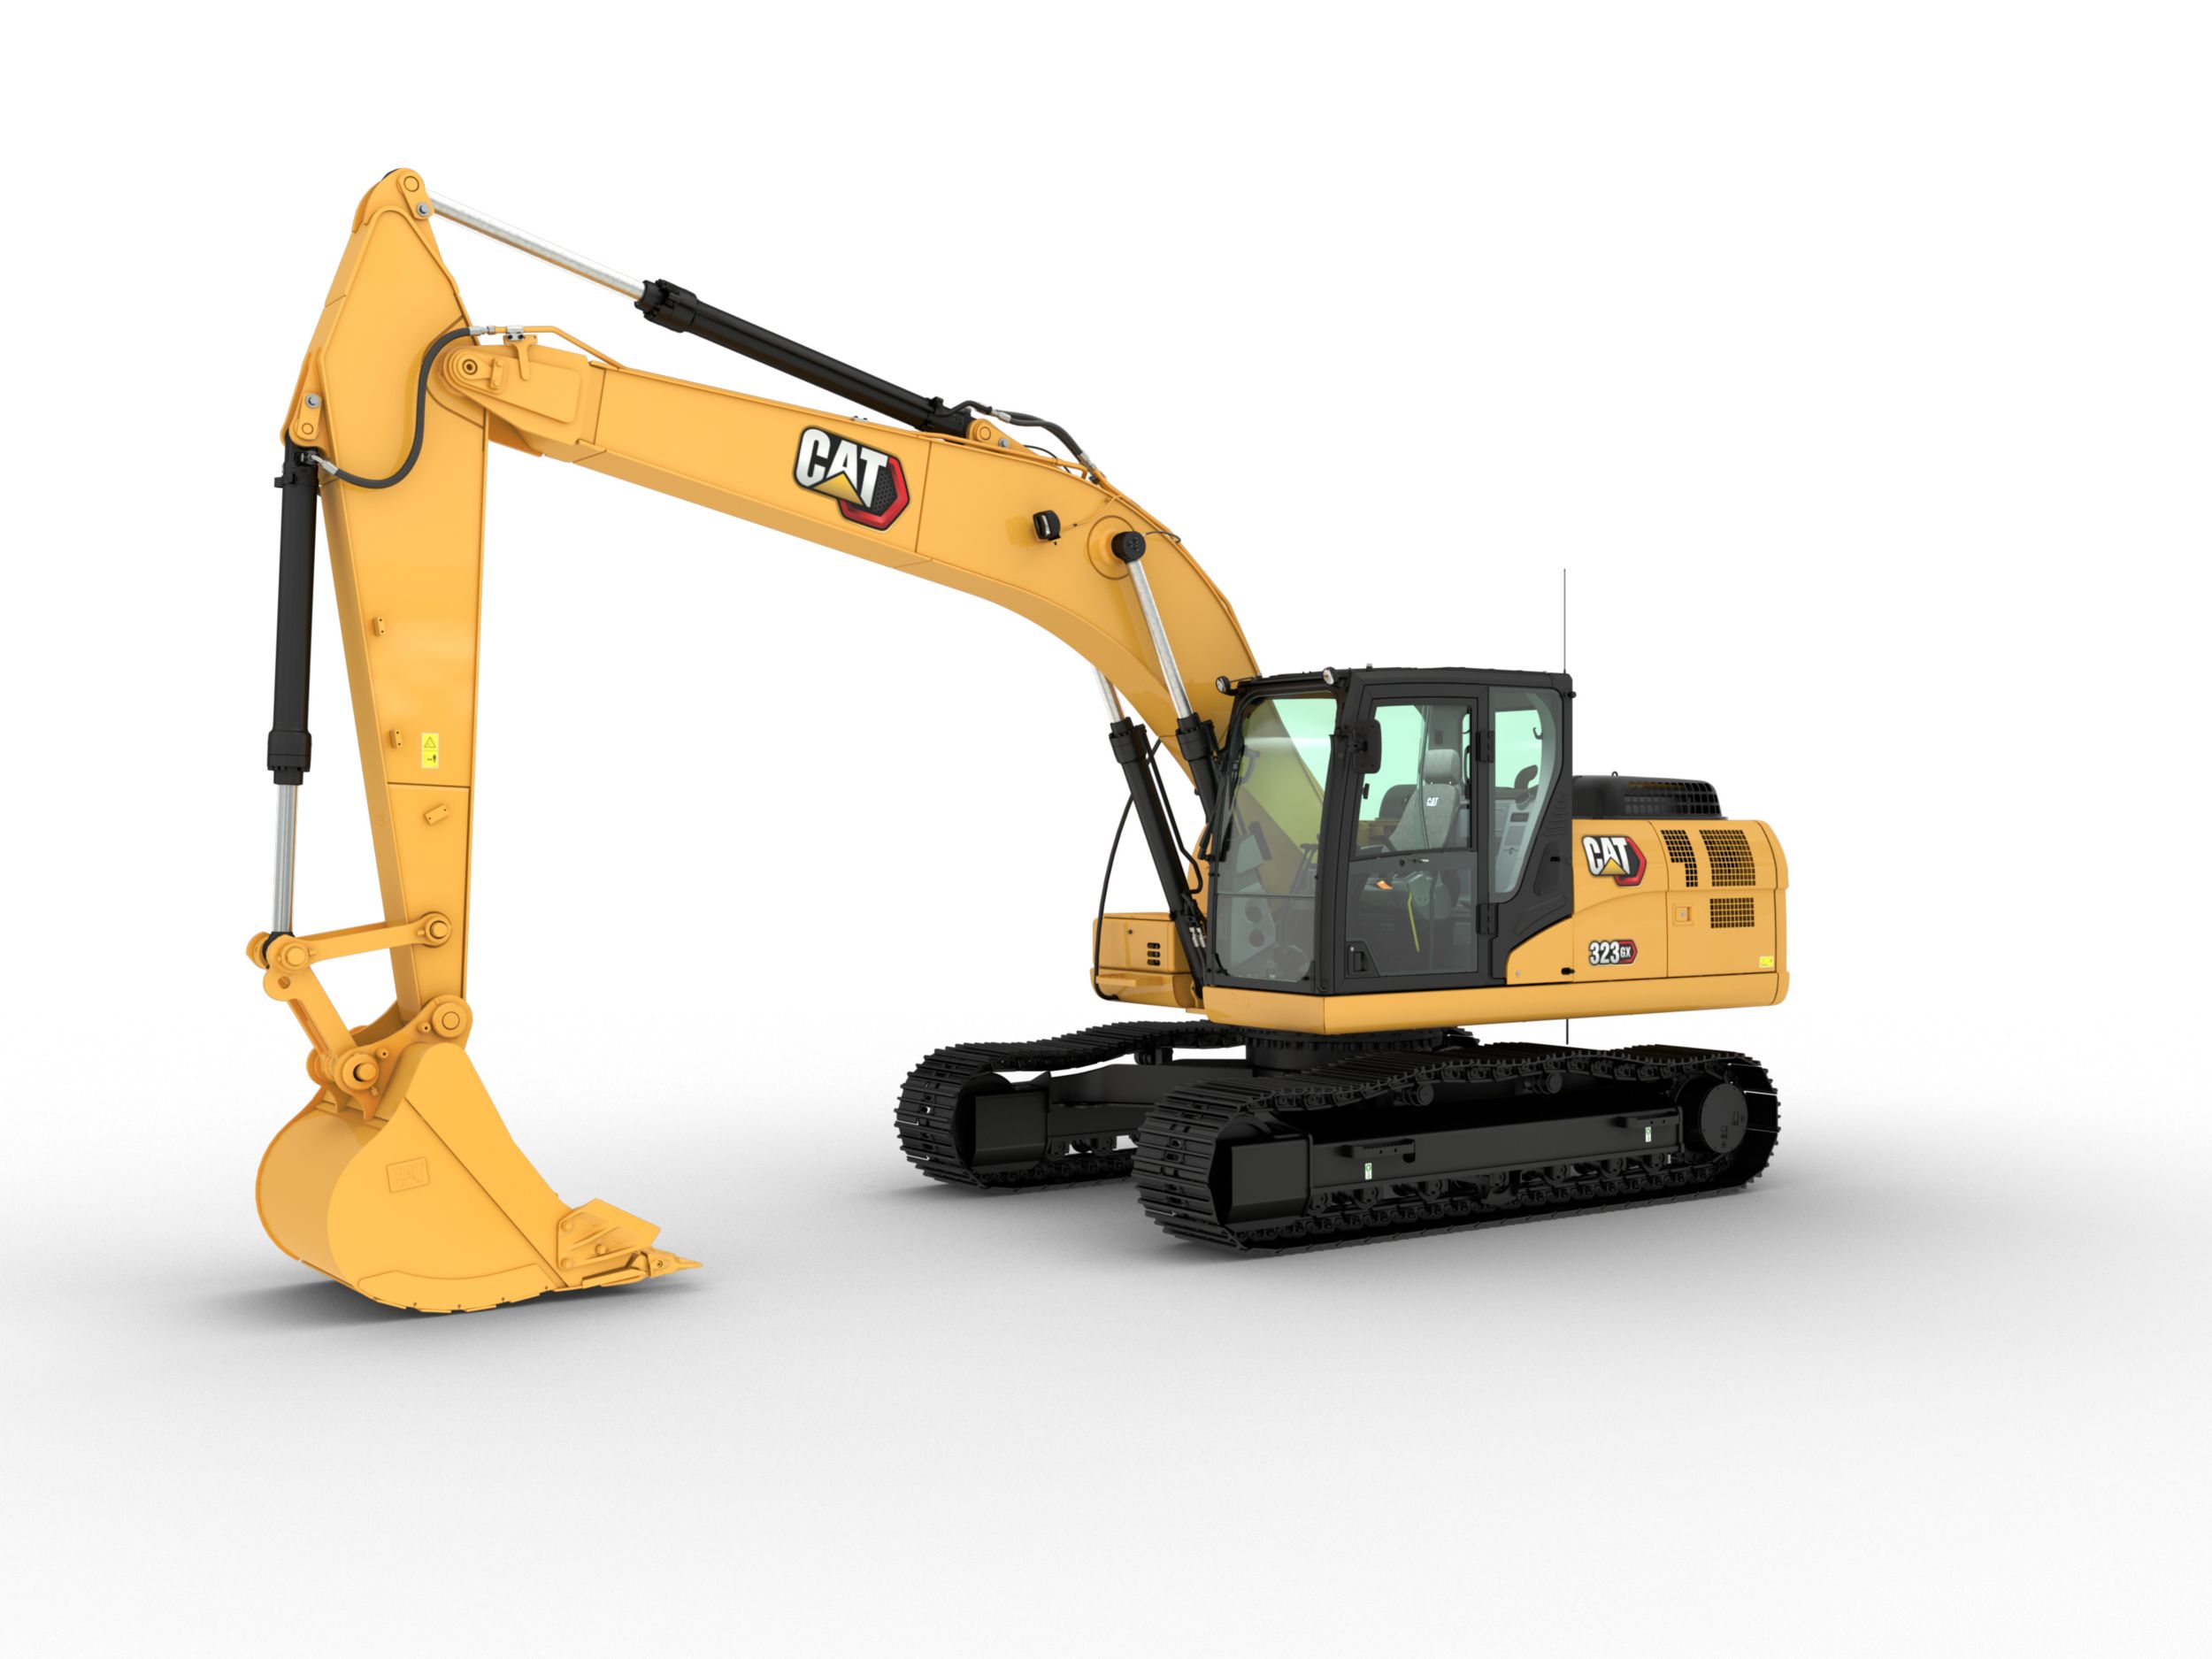
323 GX - Tier 3
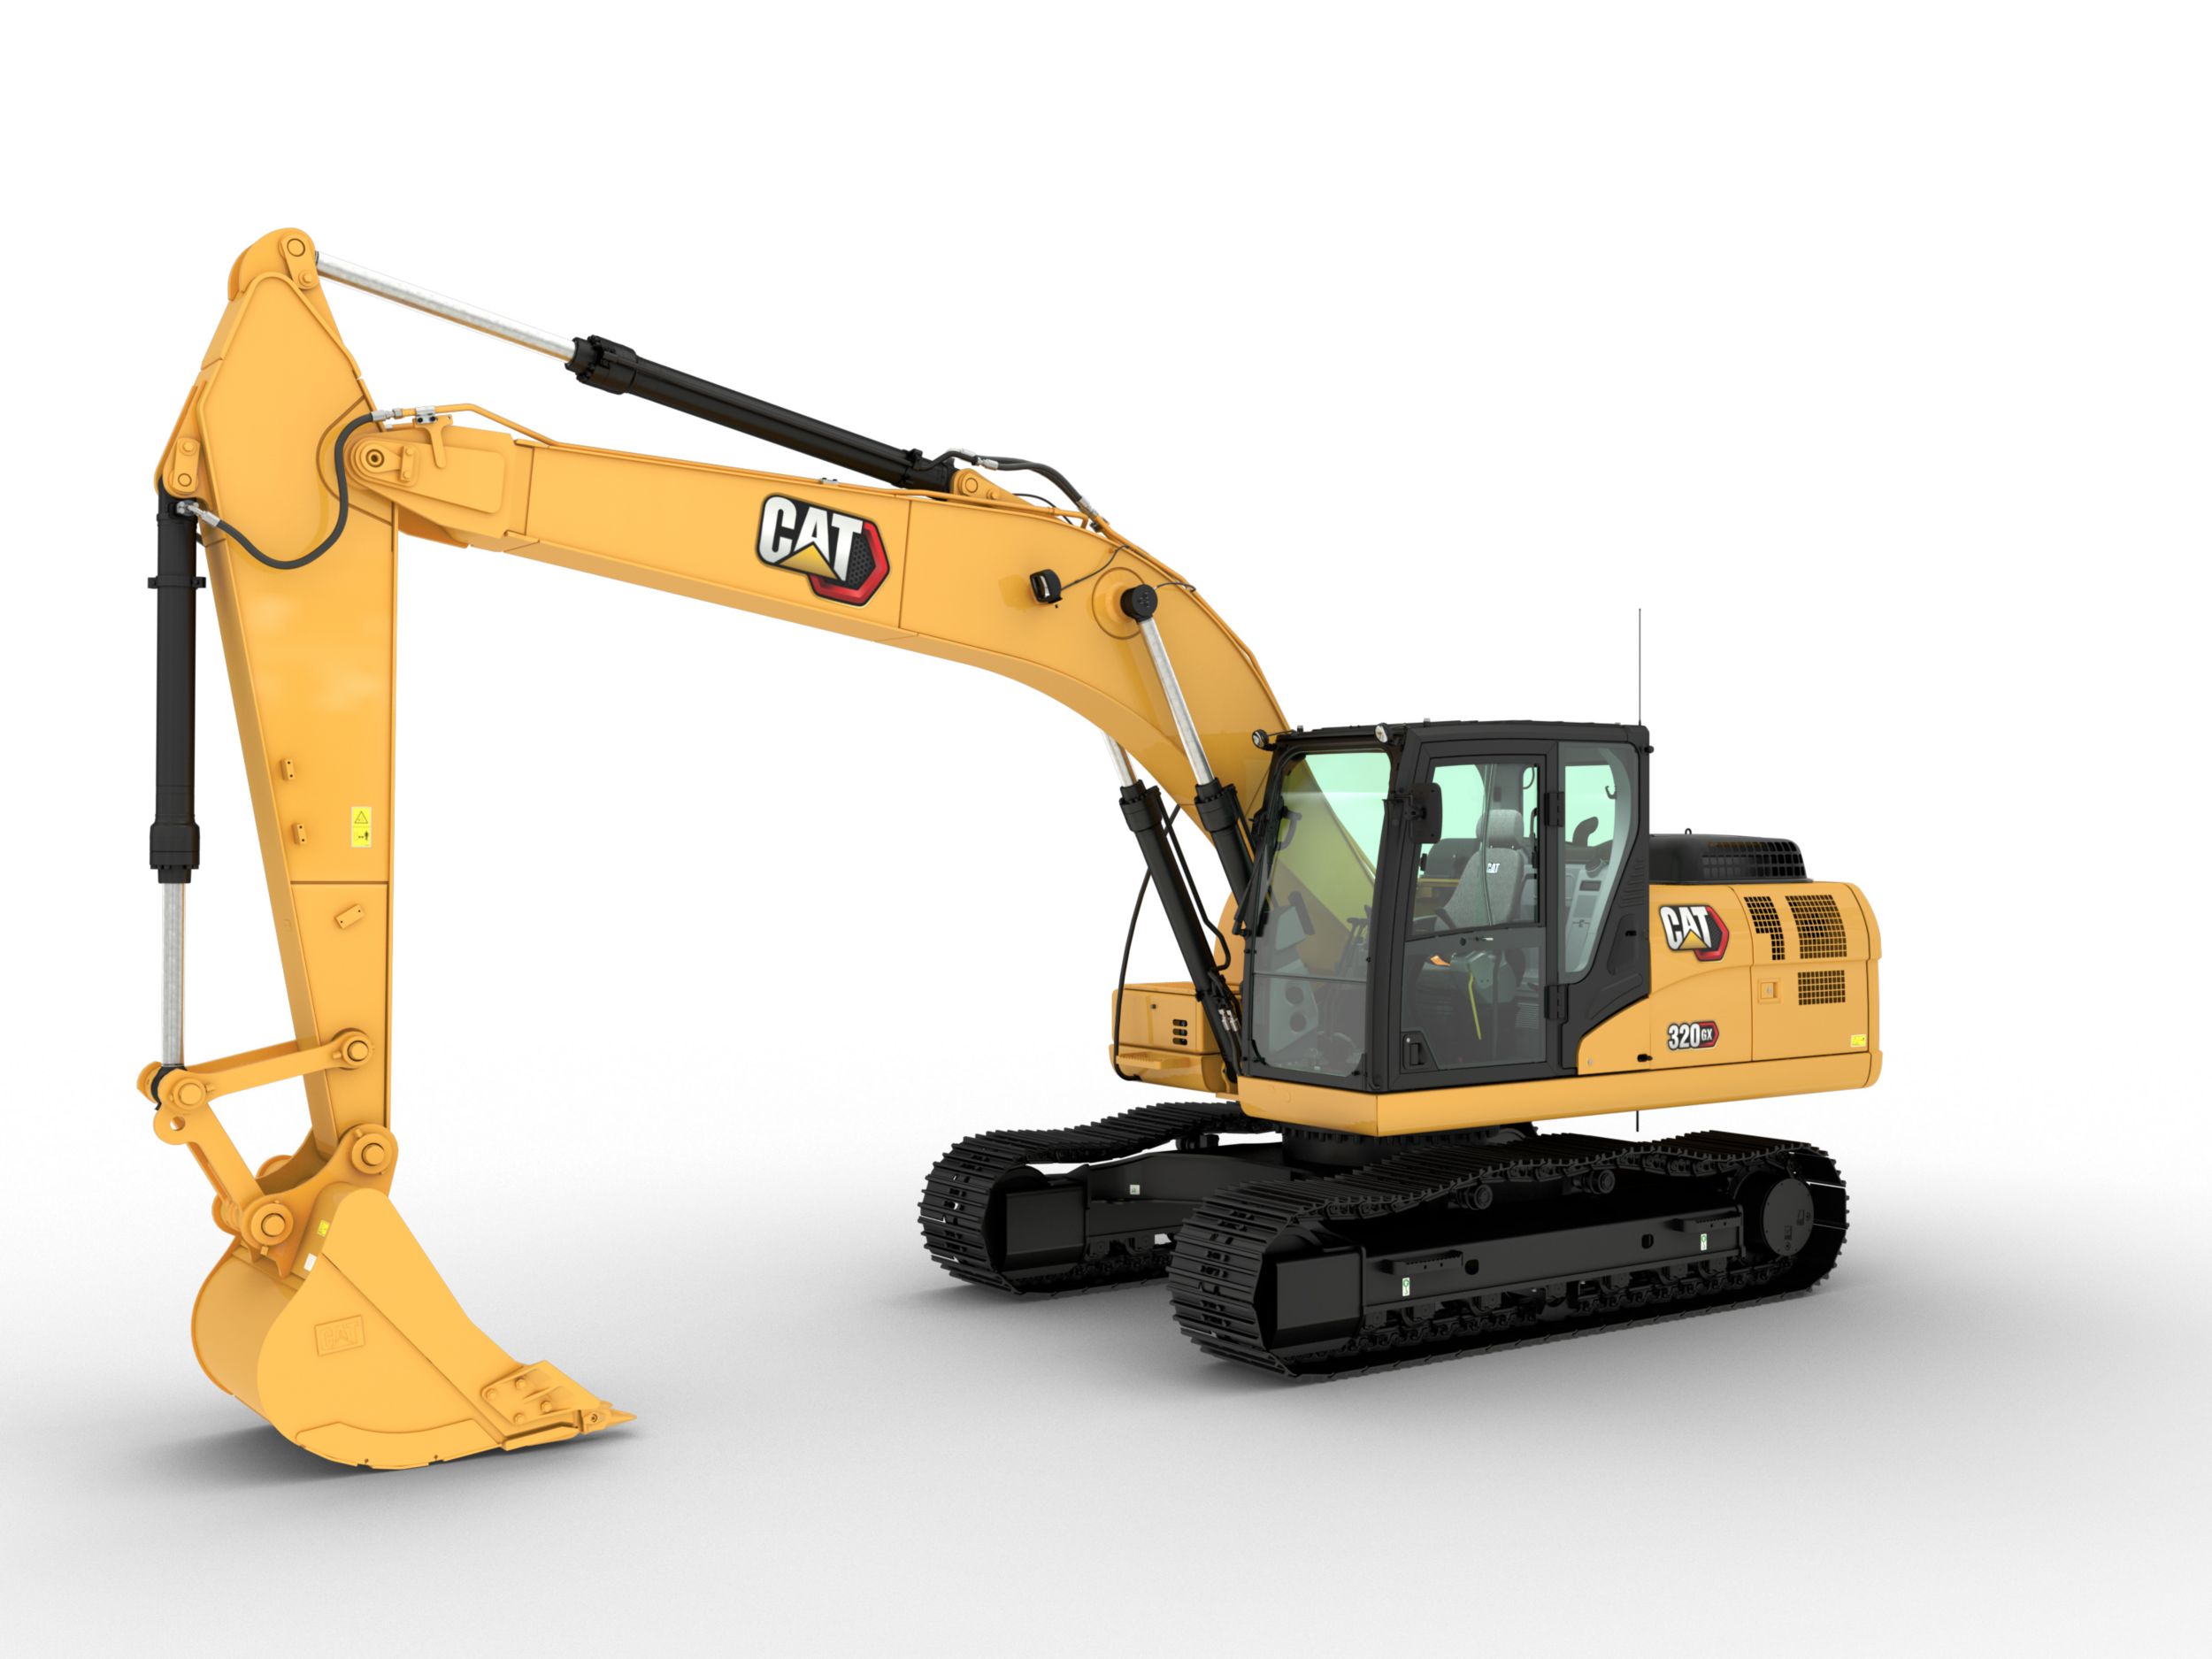
320 GX - Tier 3
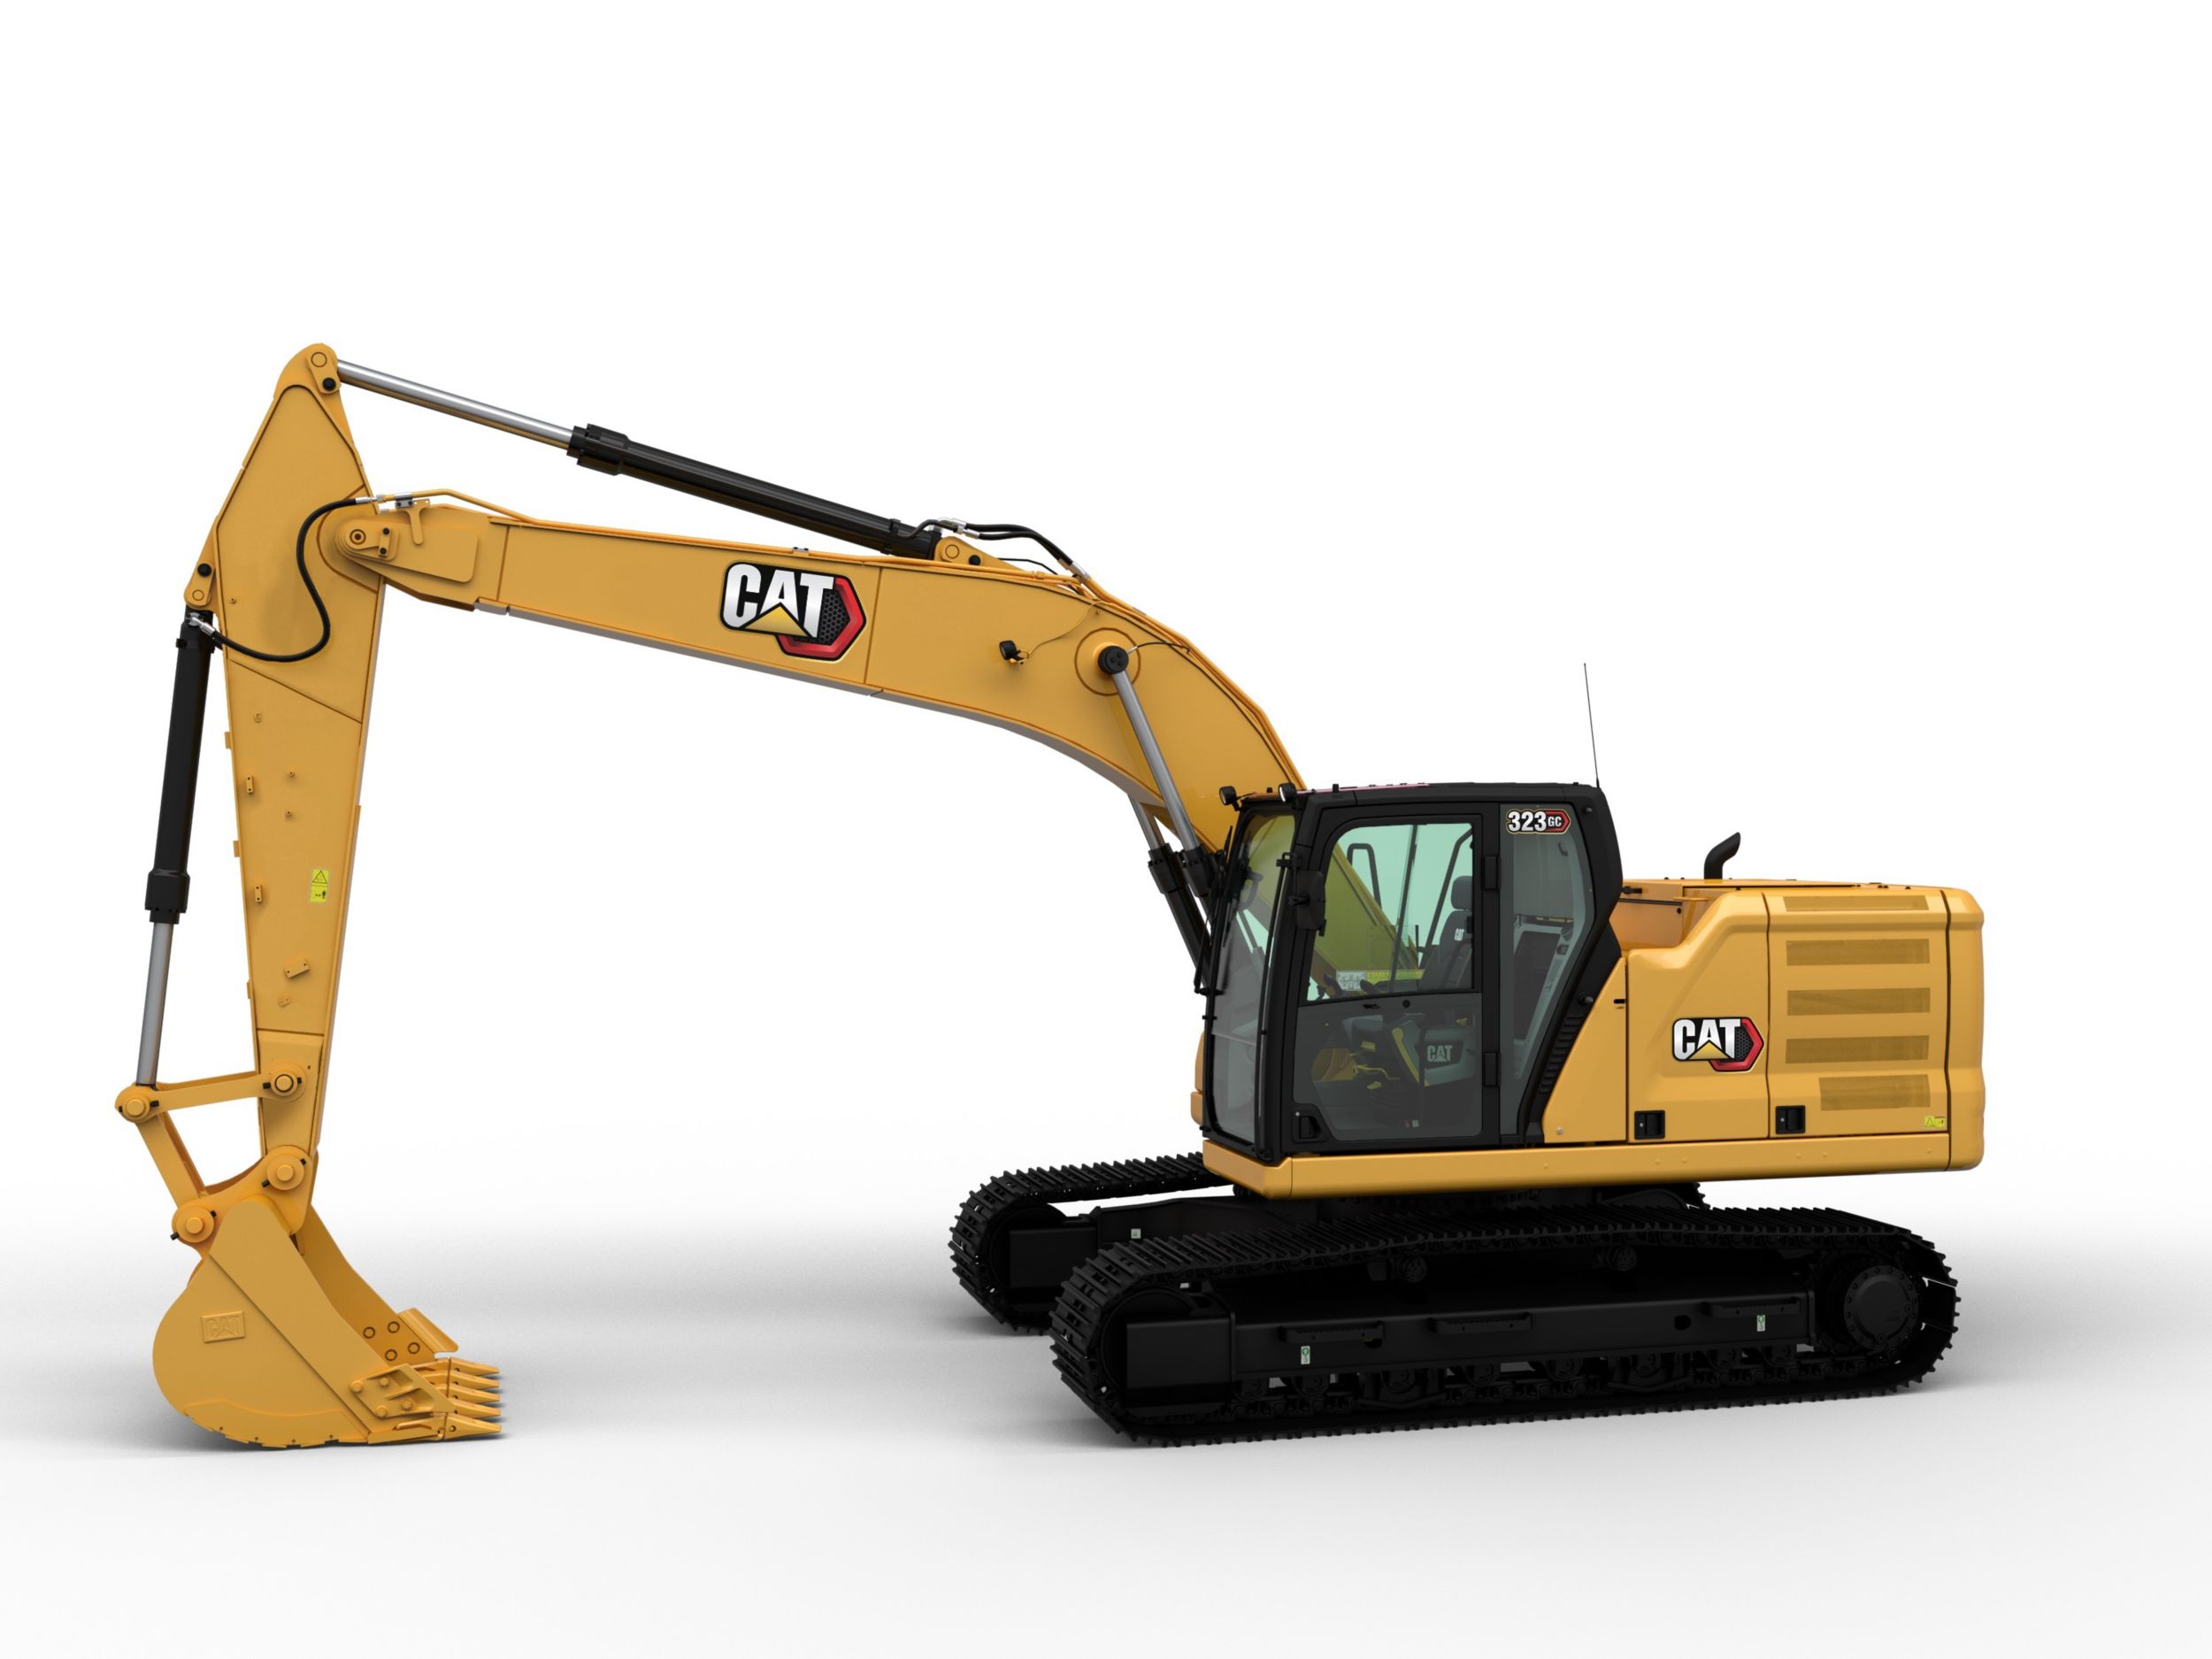
323 GC - Tier 3
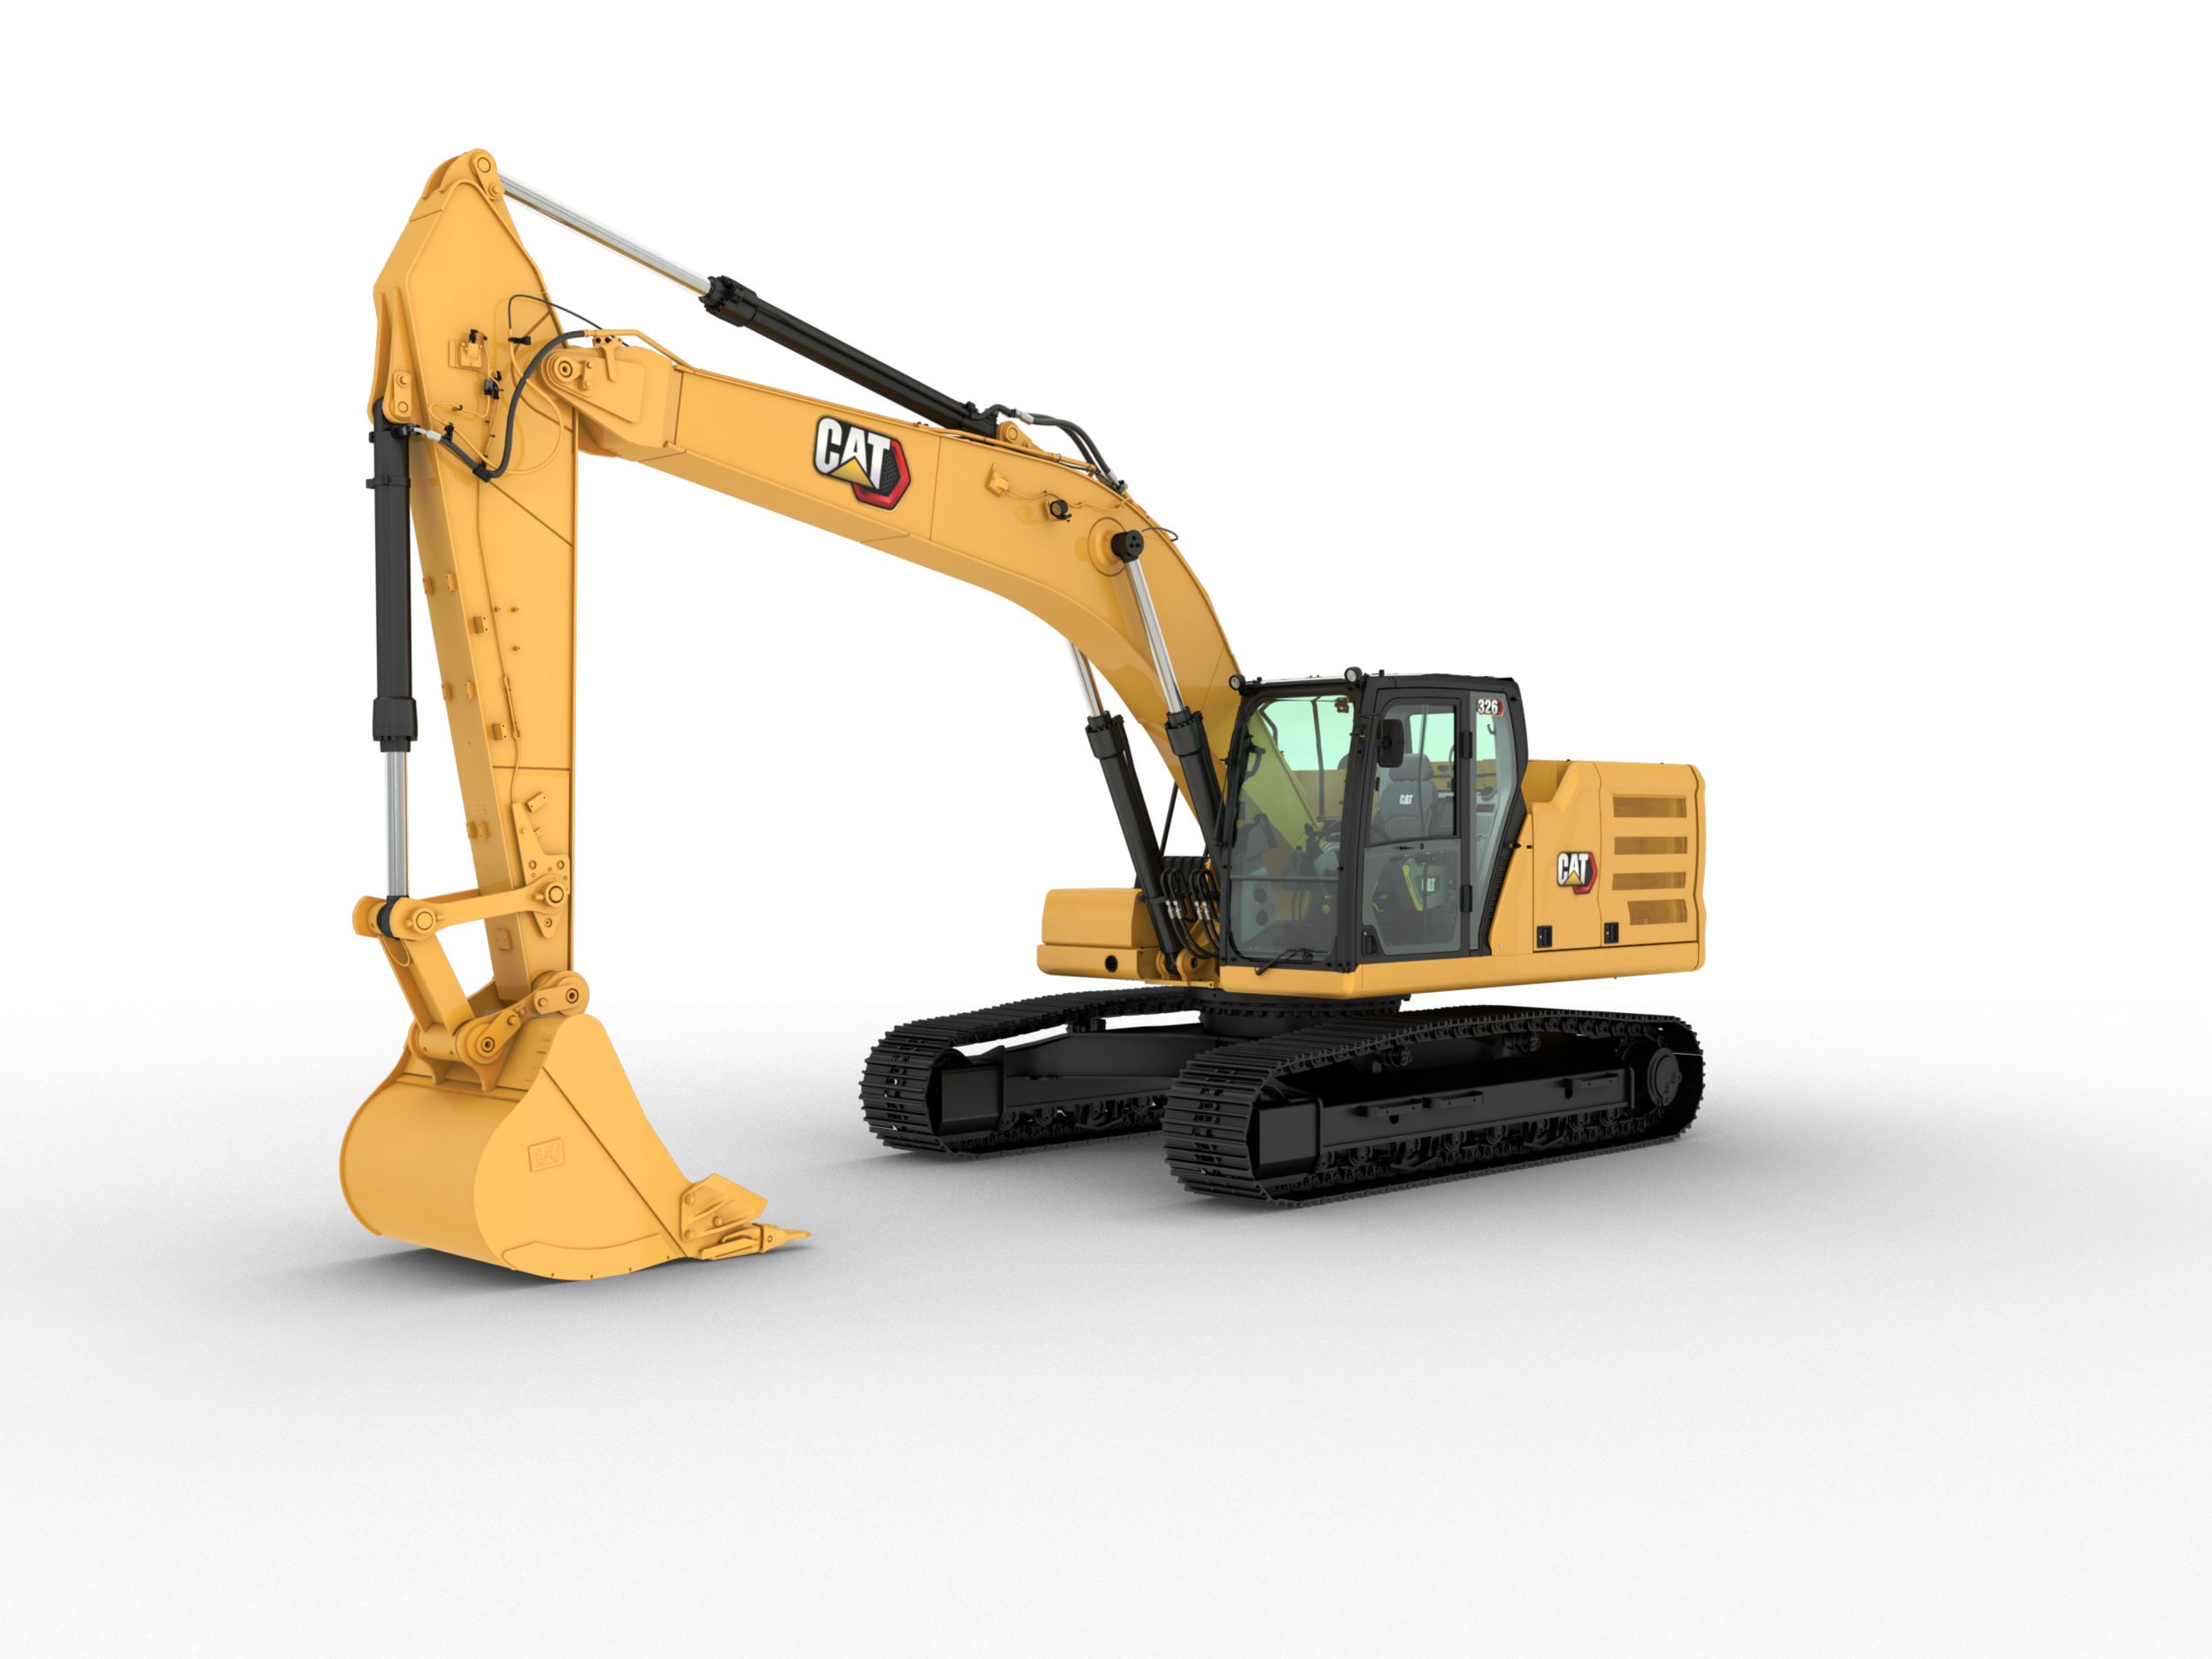
326 - Tier 3
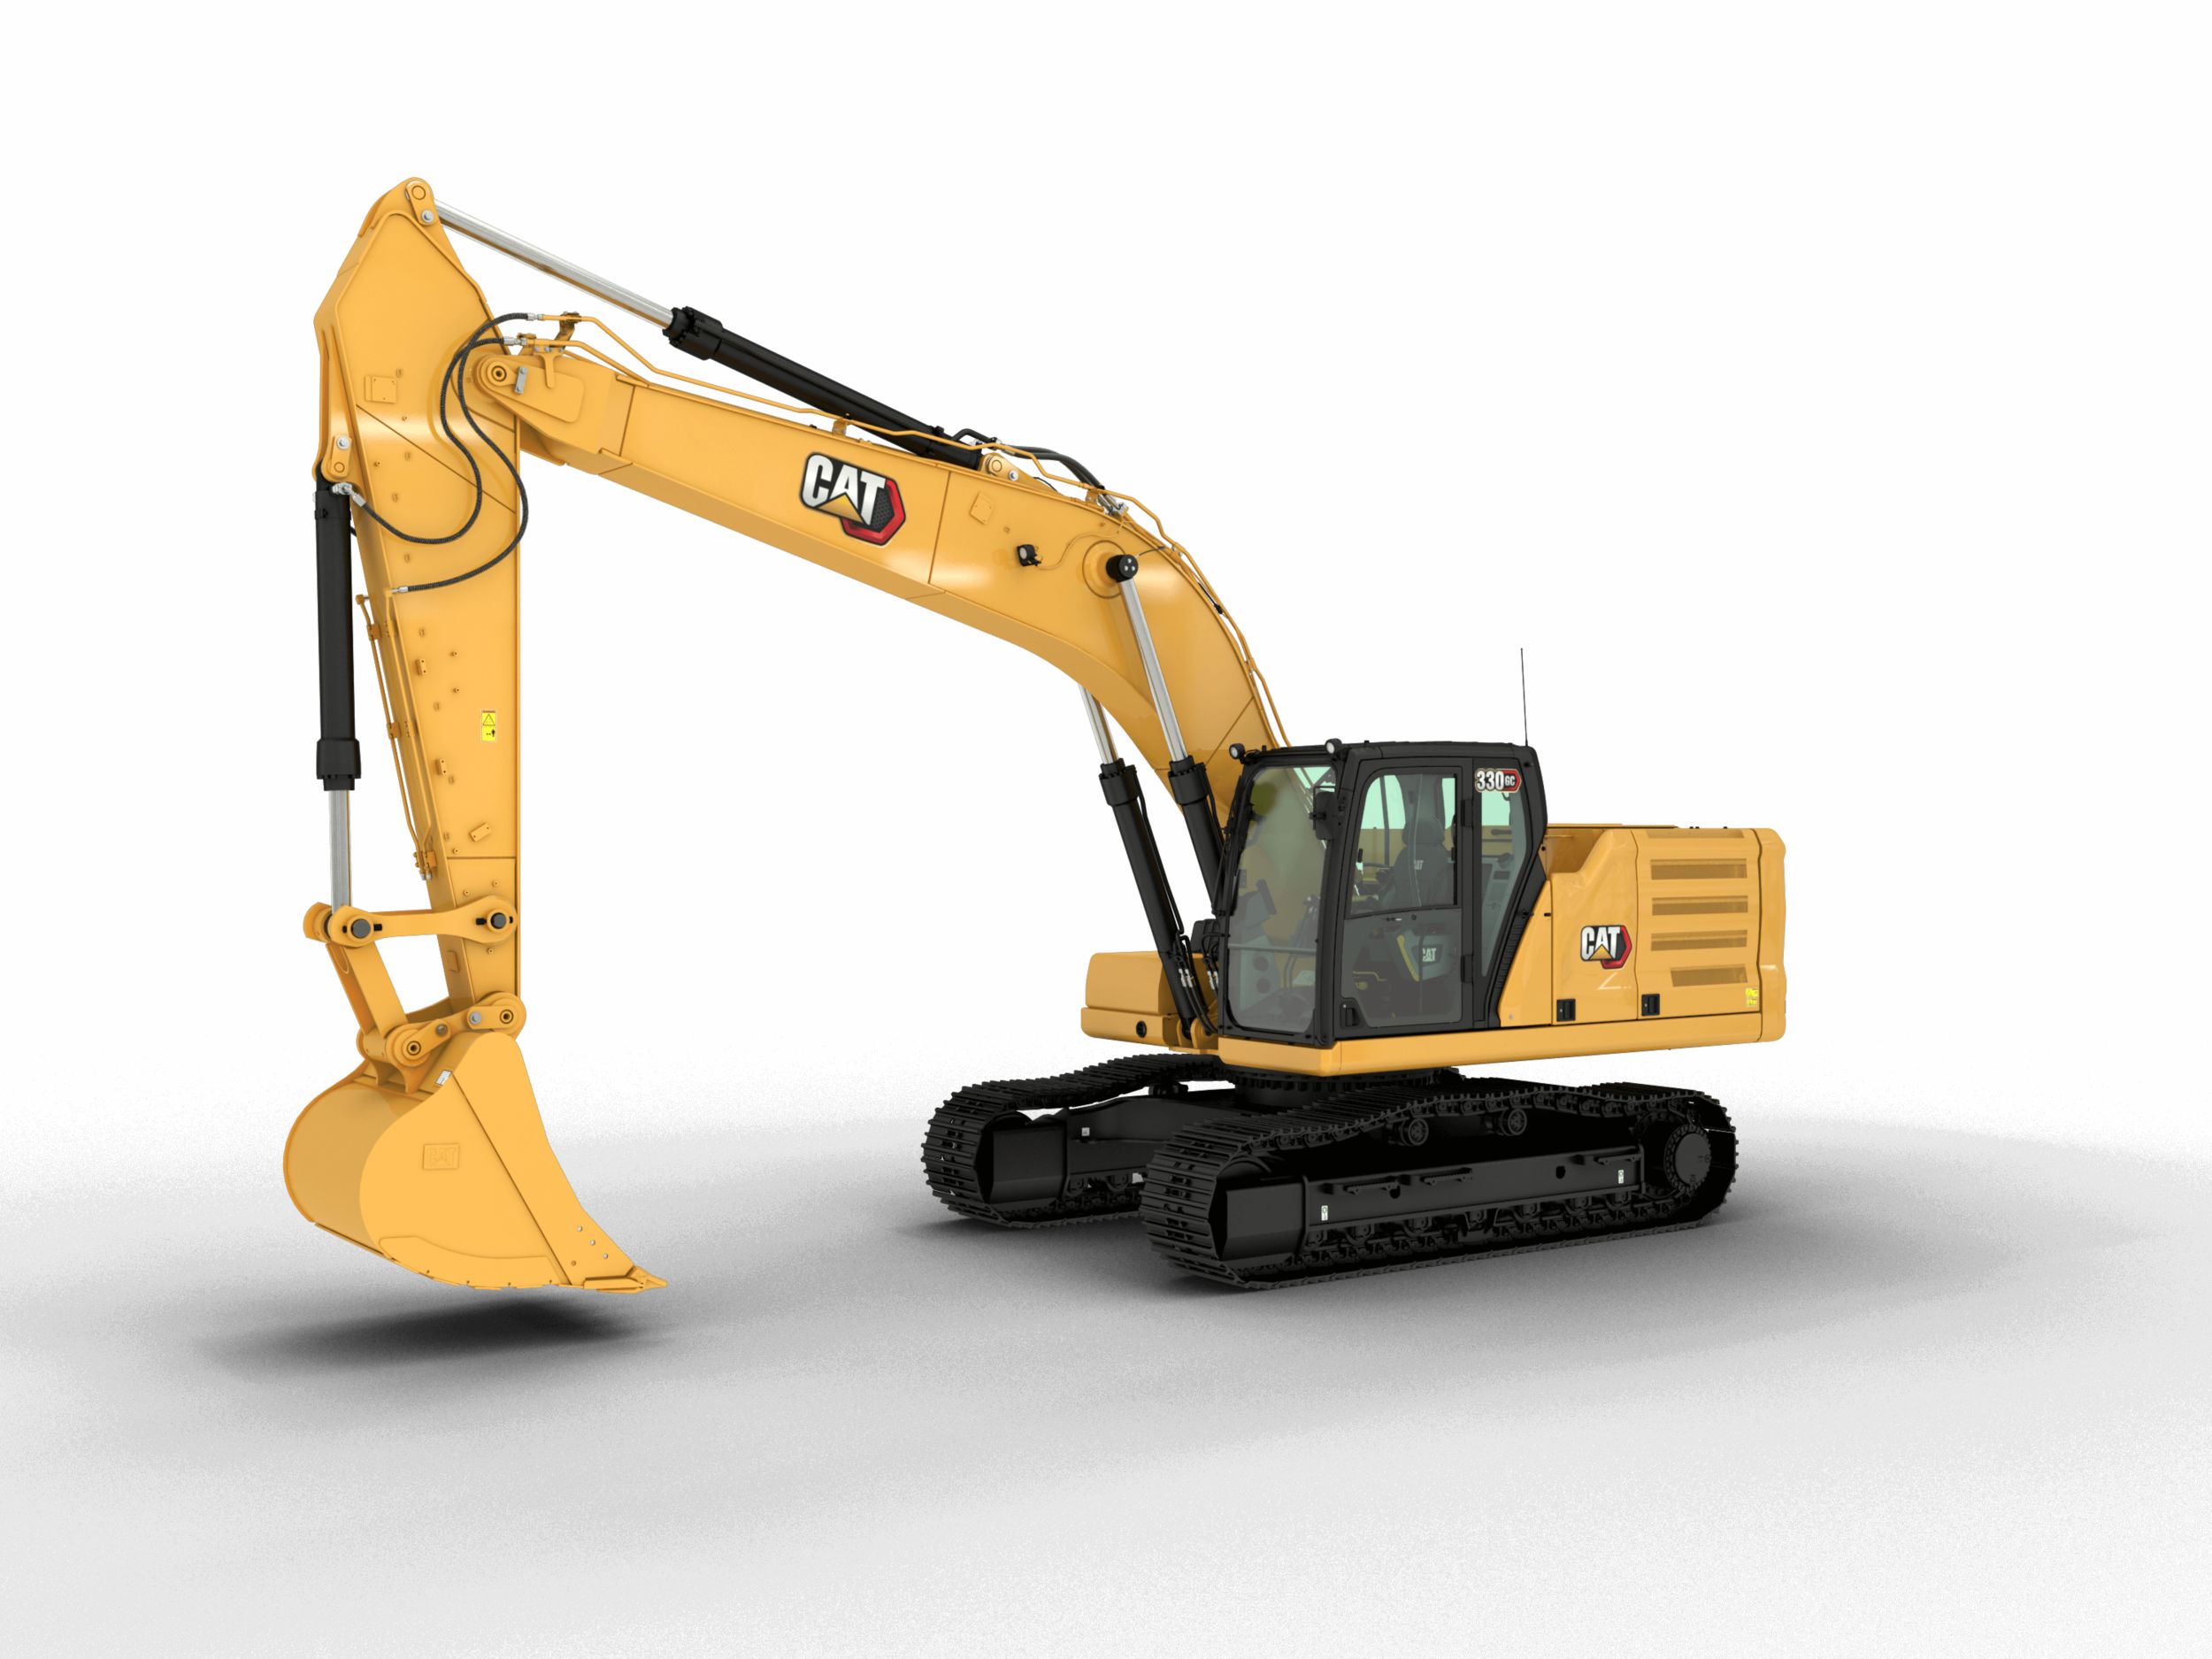
330 GC - Tier 3
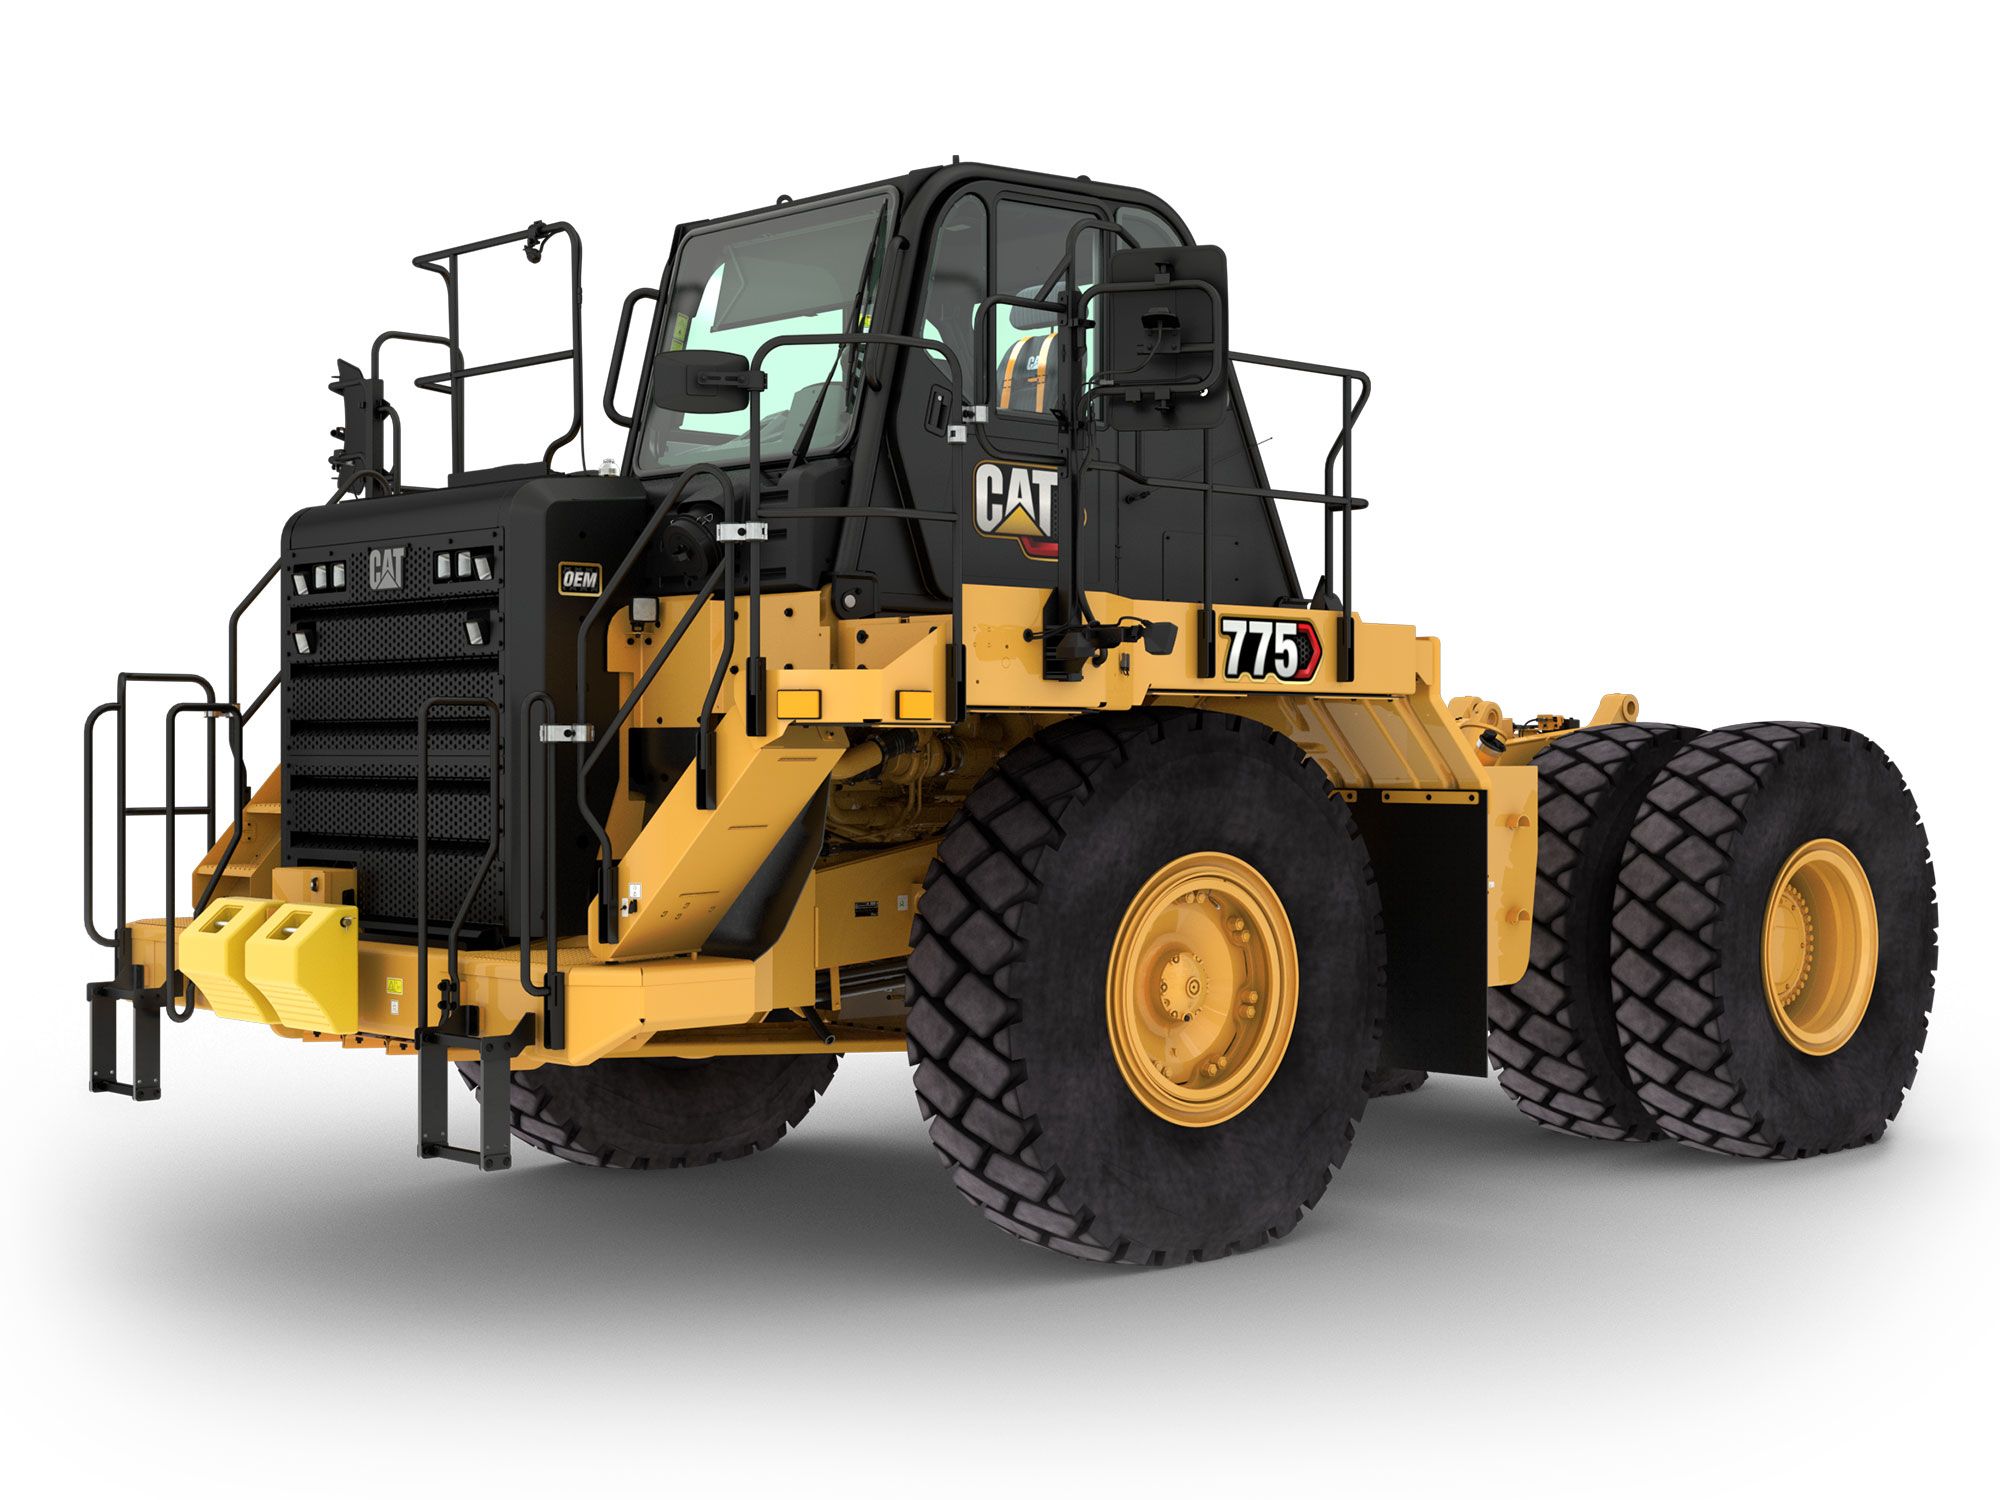
775 Bare Chassis
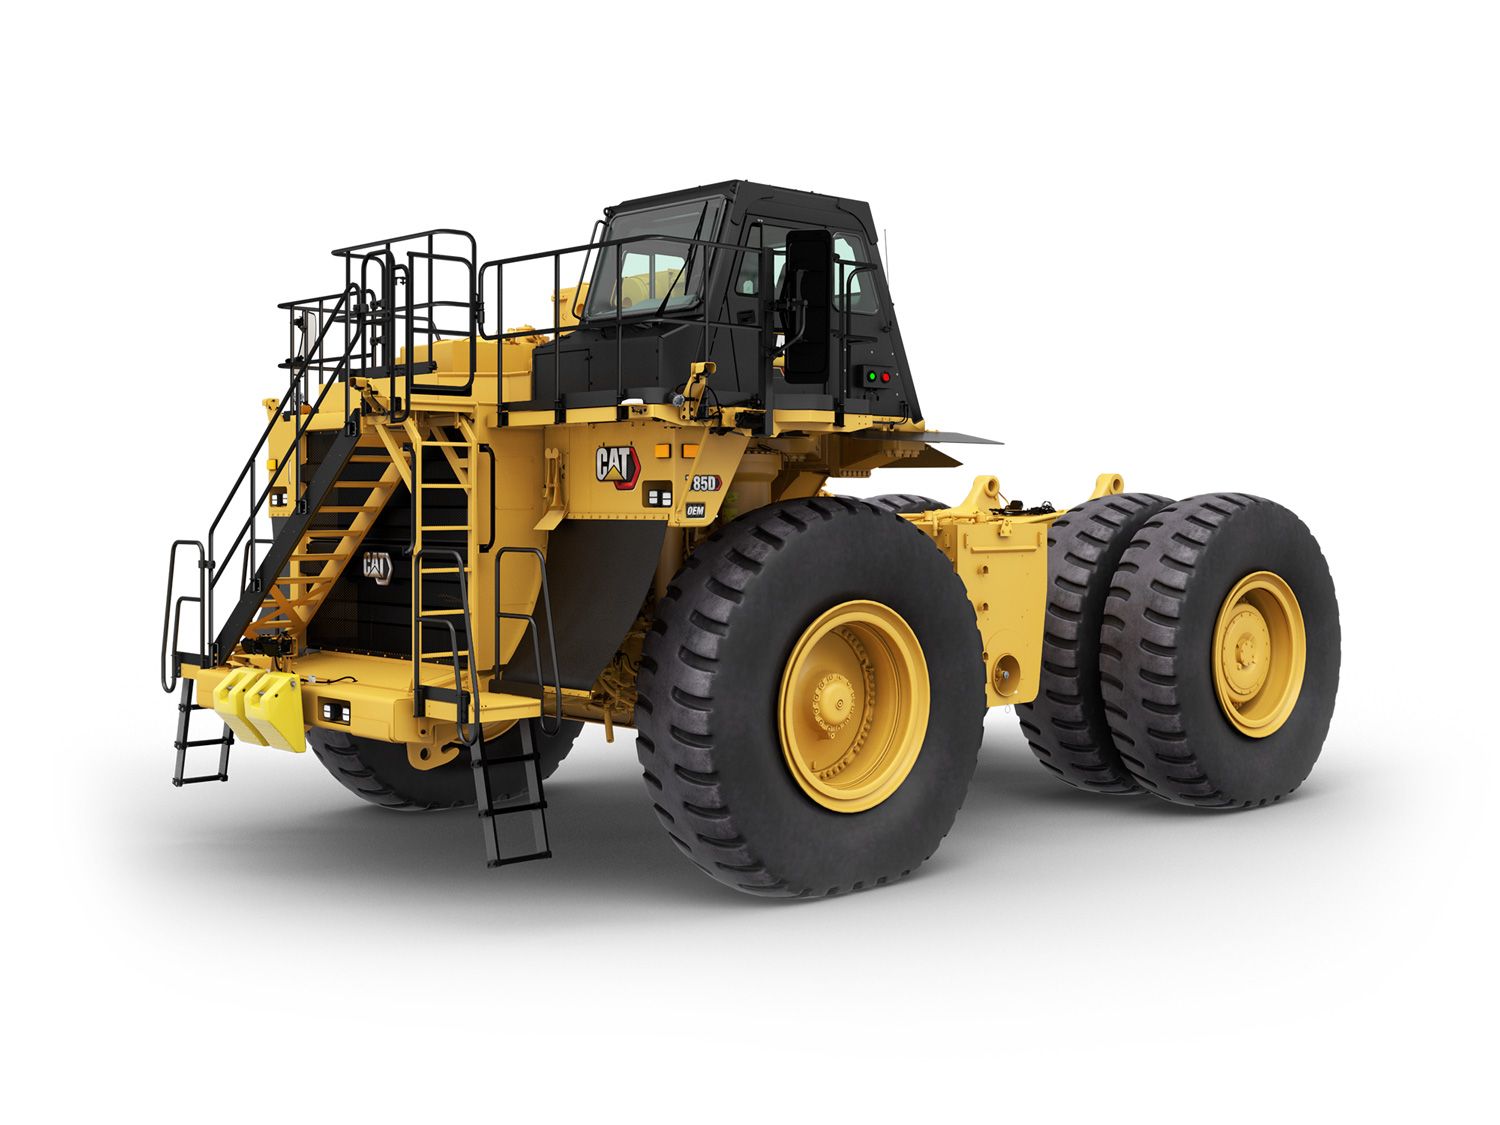
785D Bare Chassis
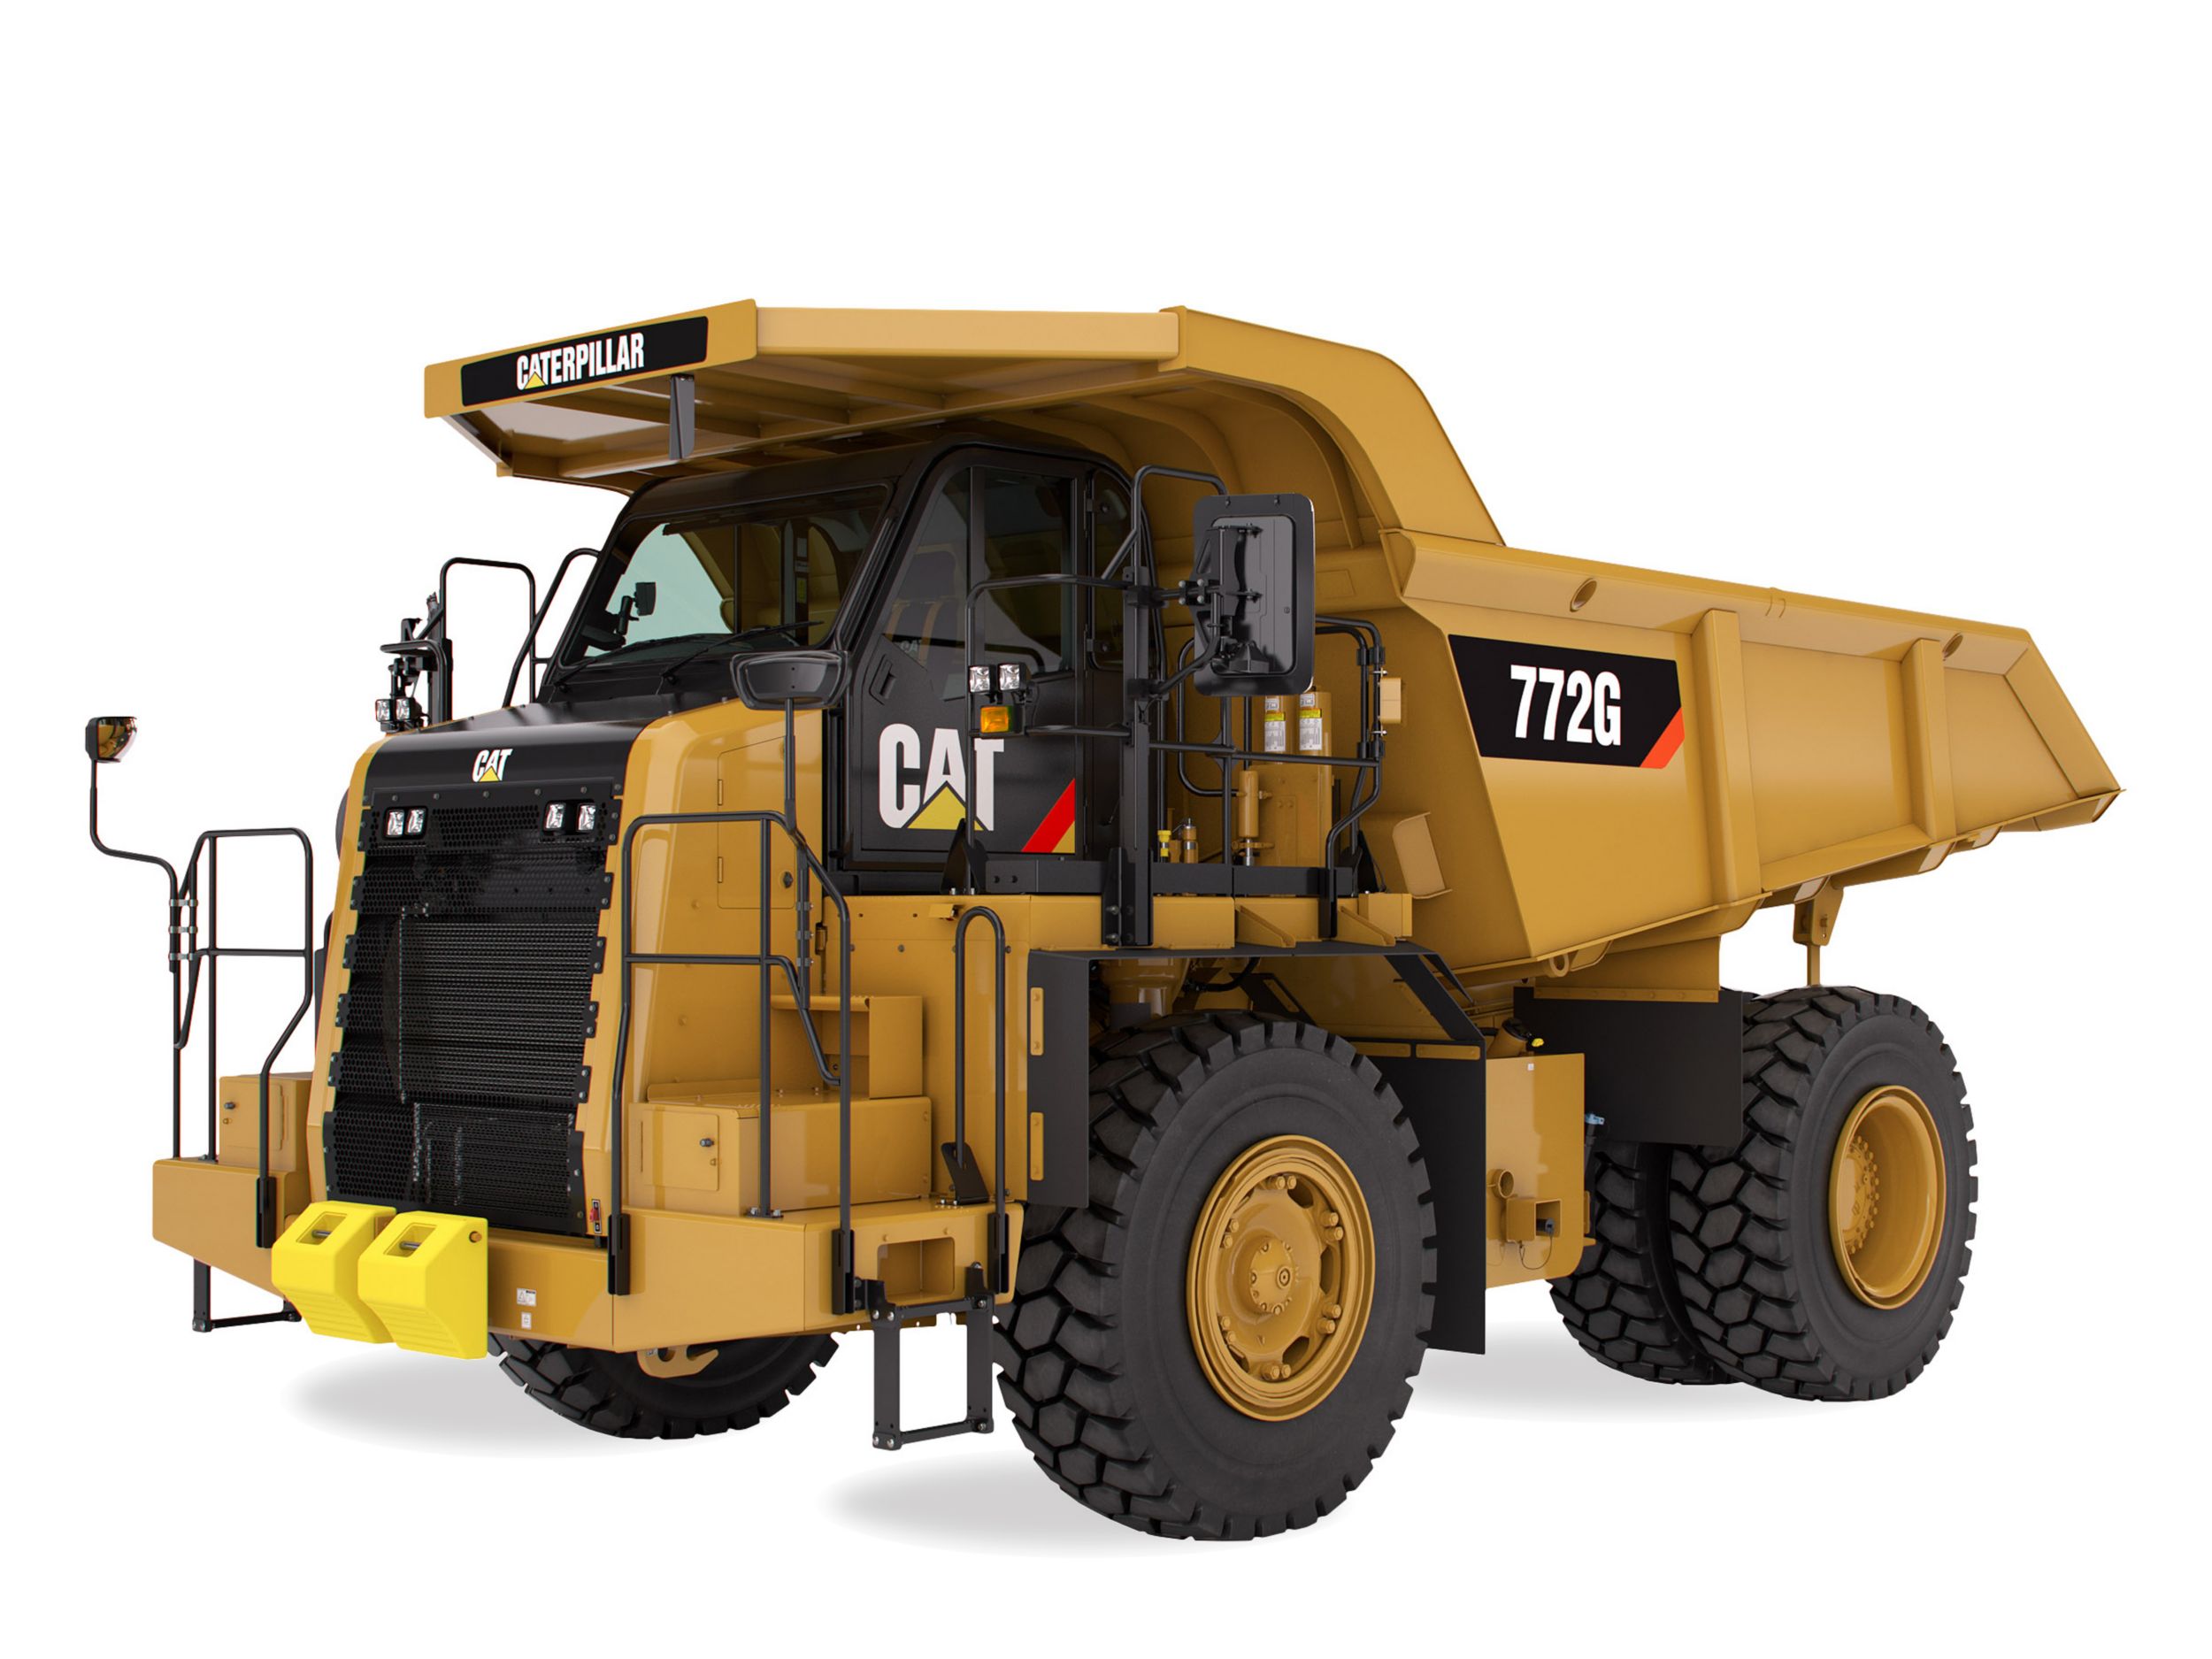
772G
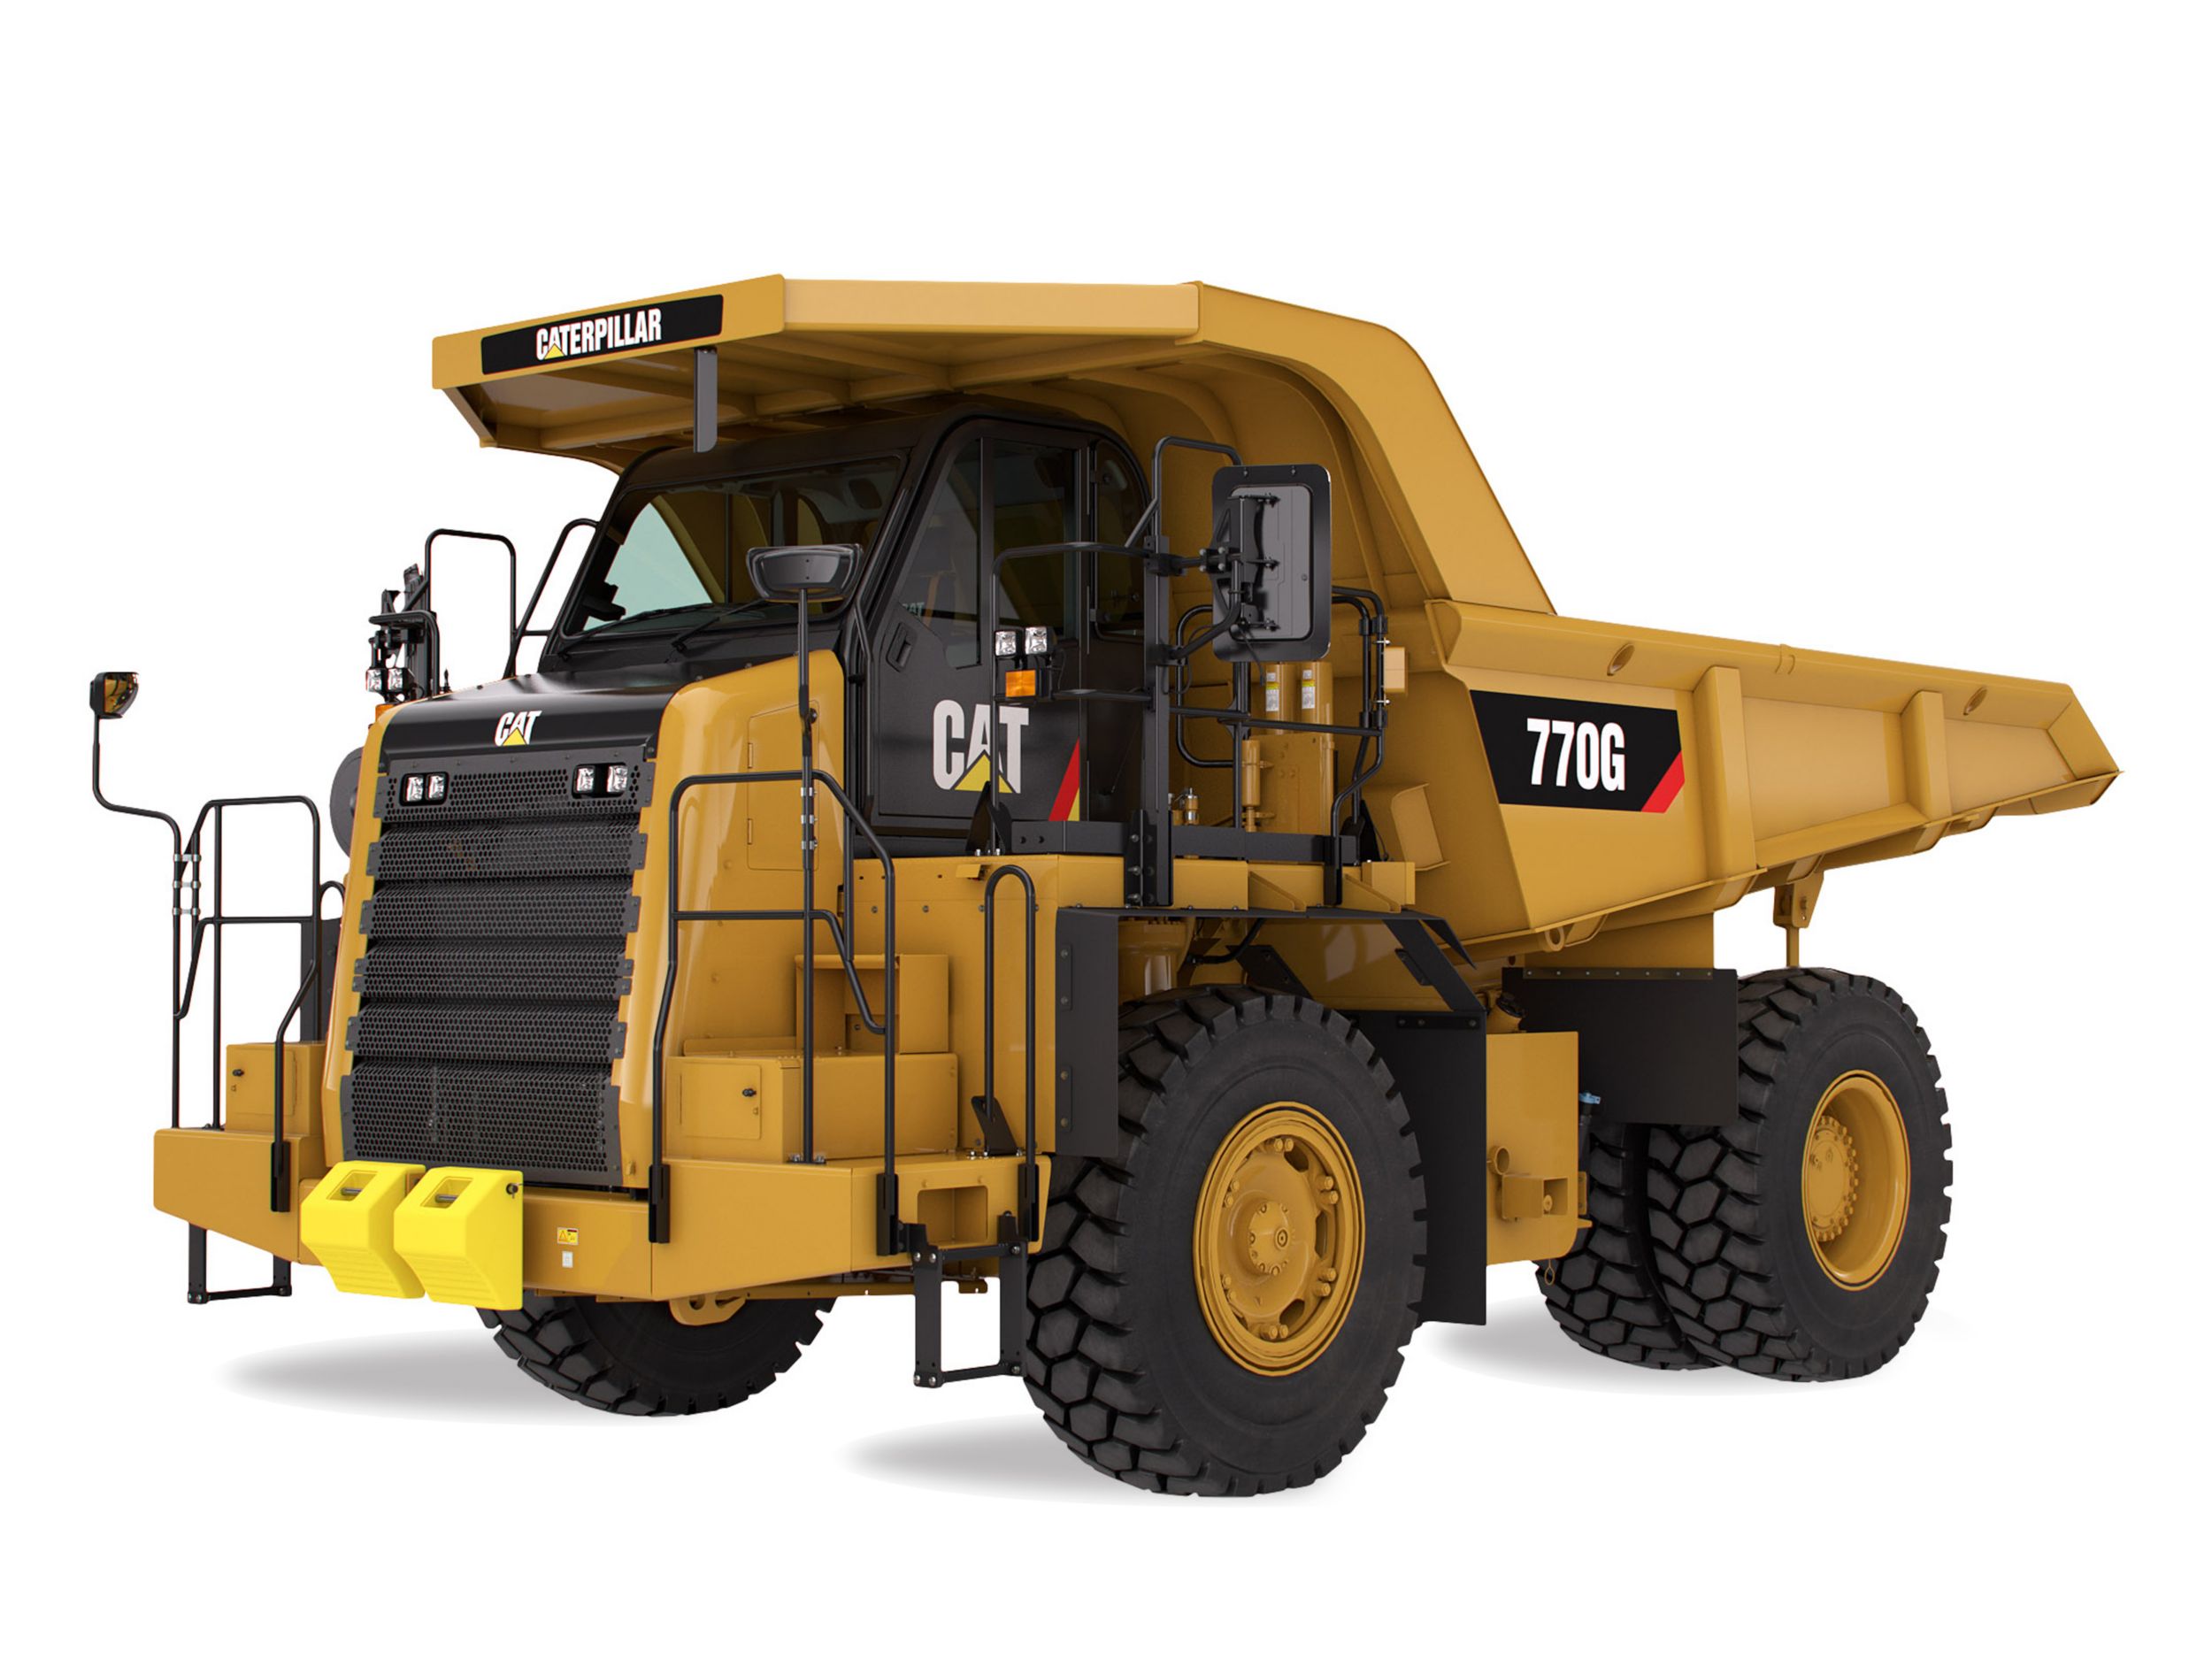
770G
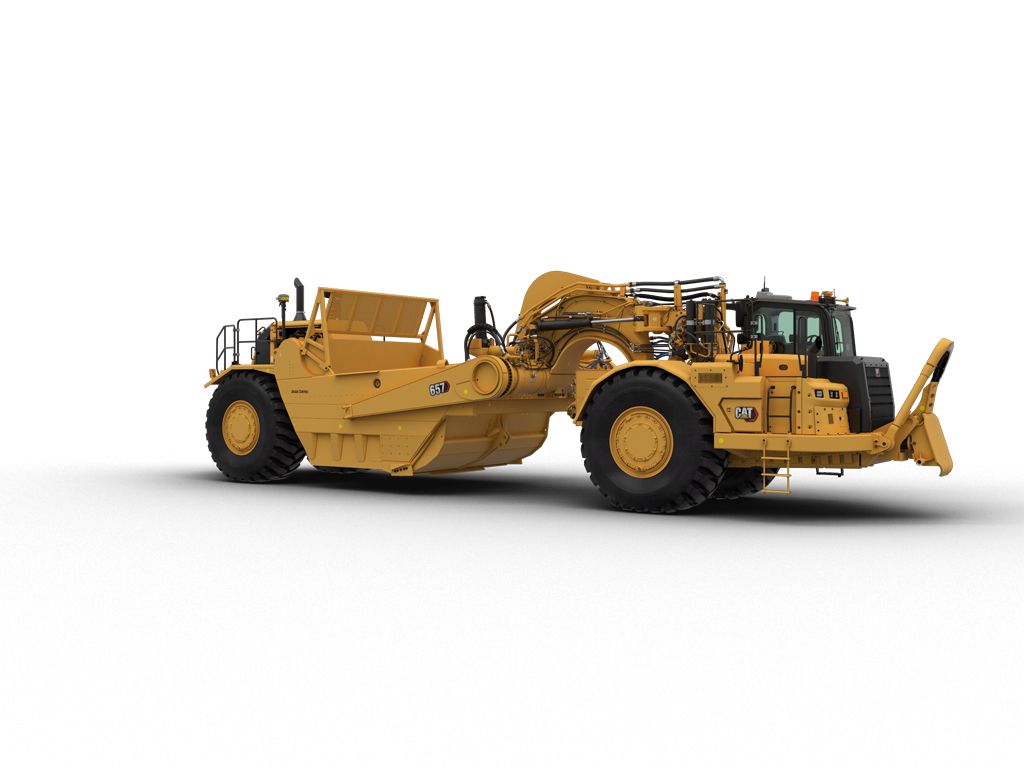
657
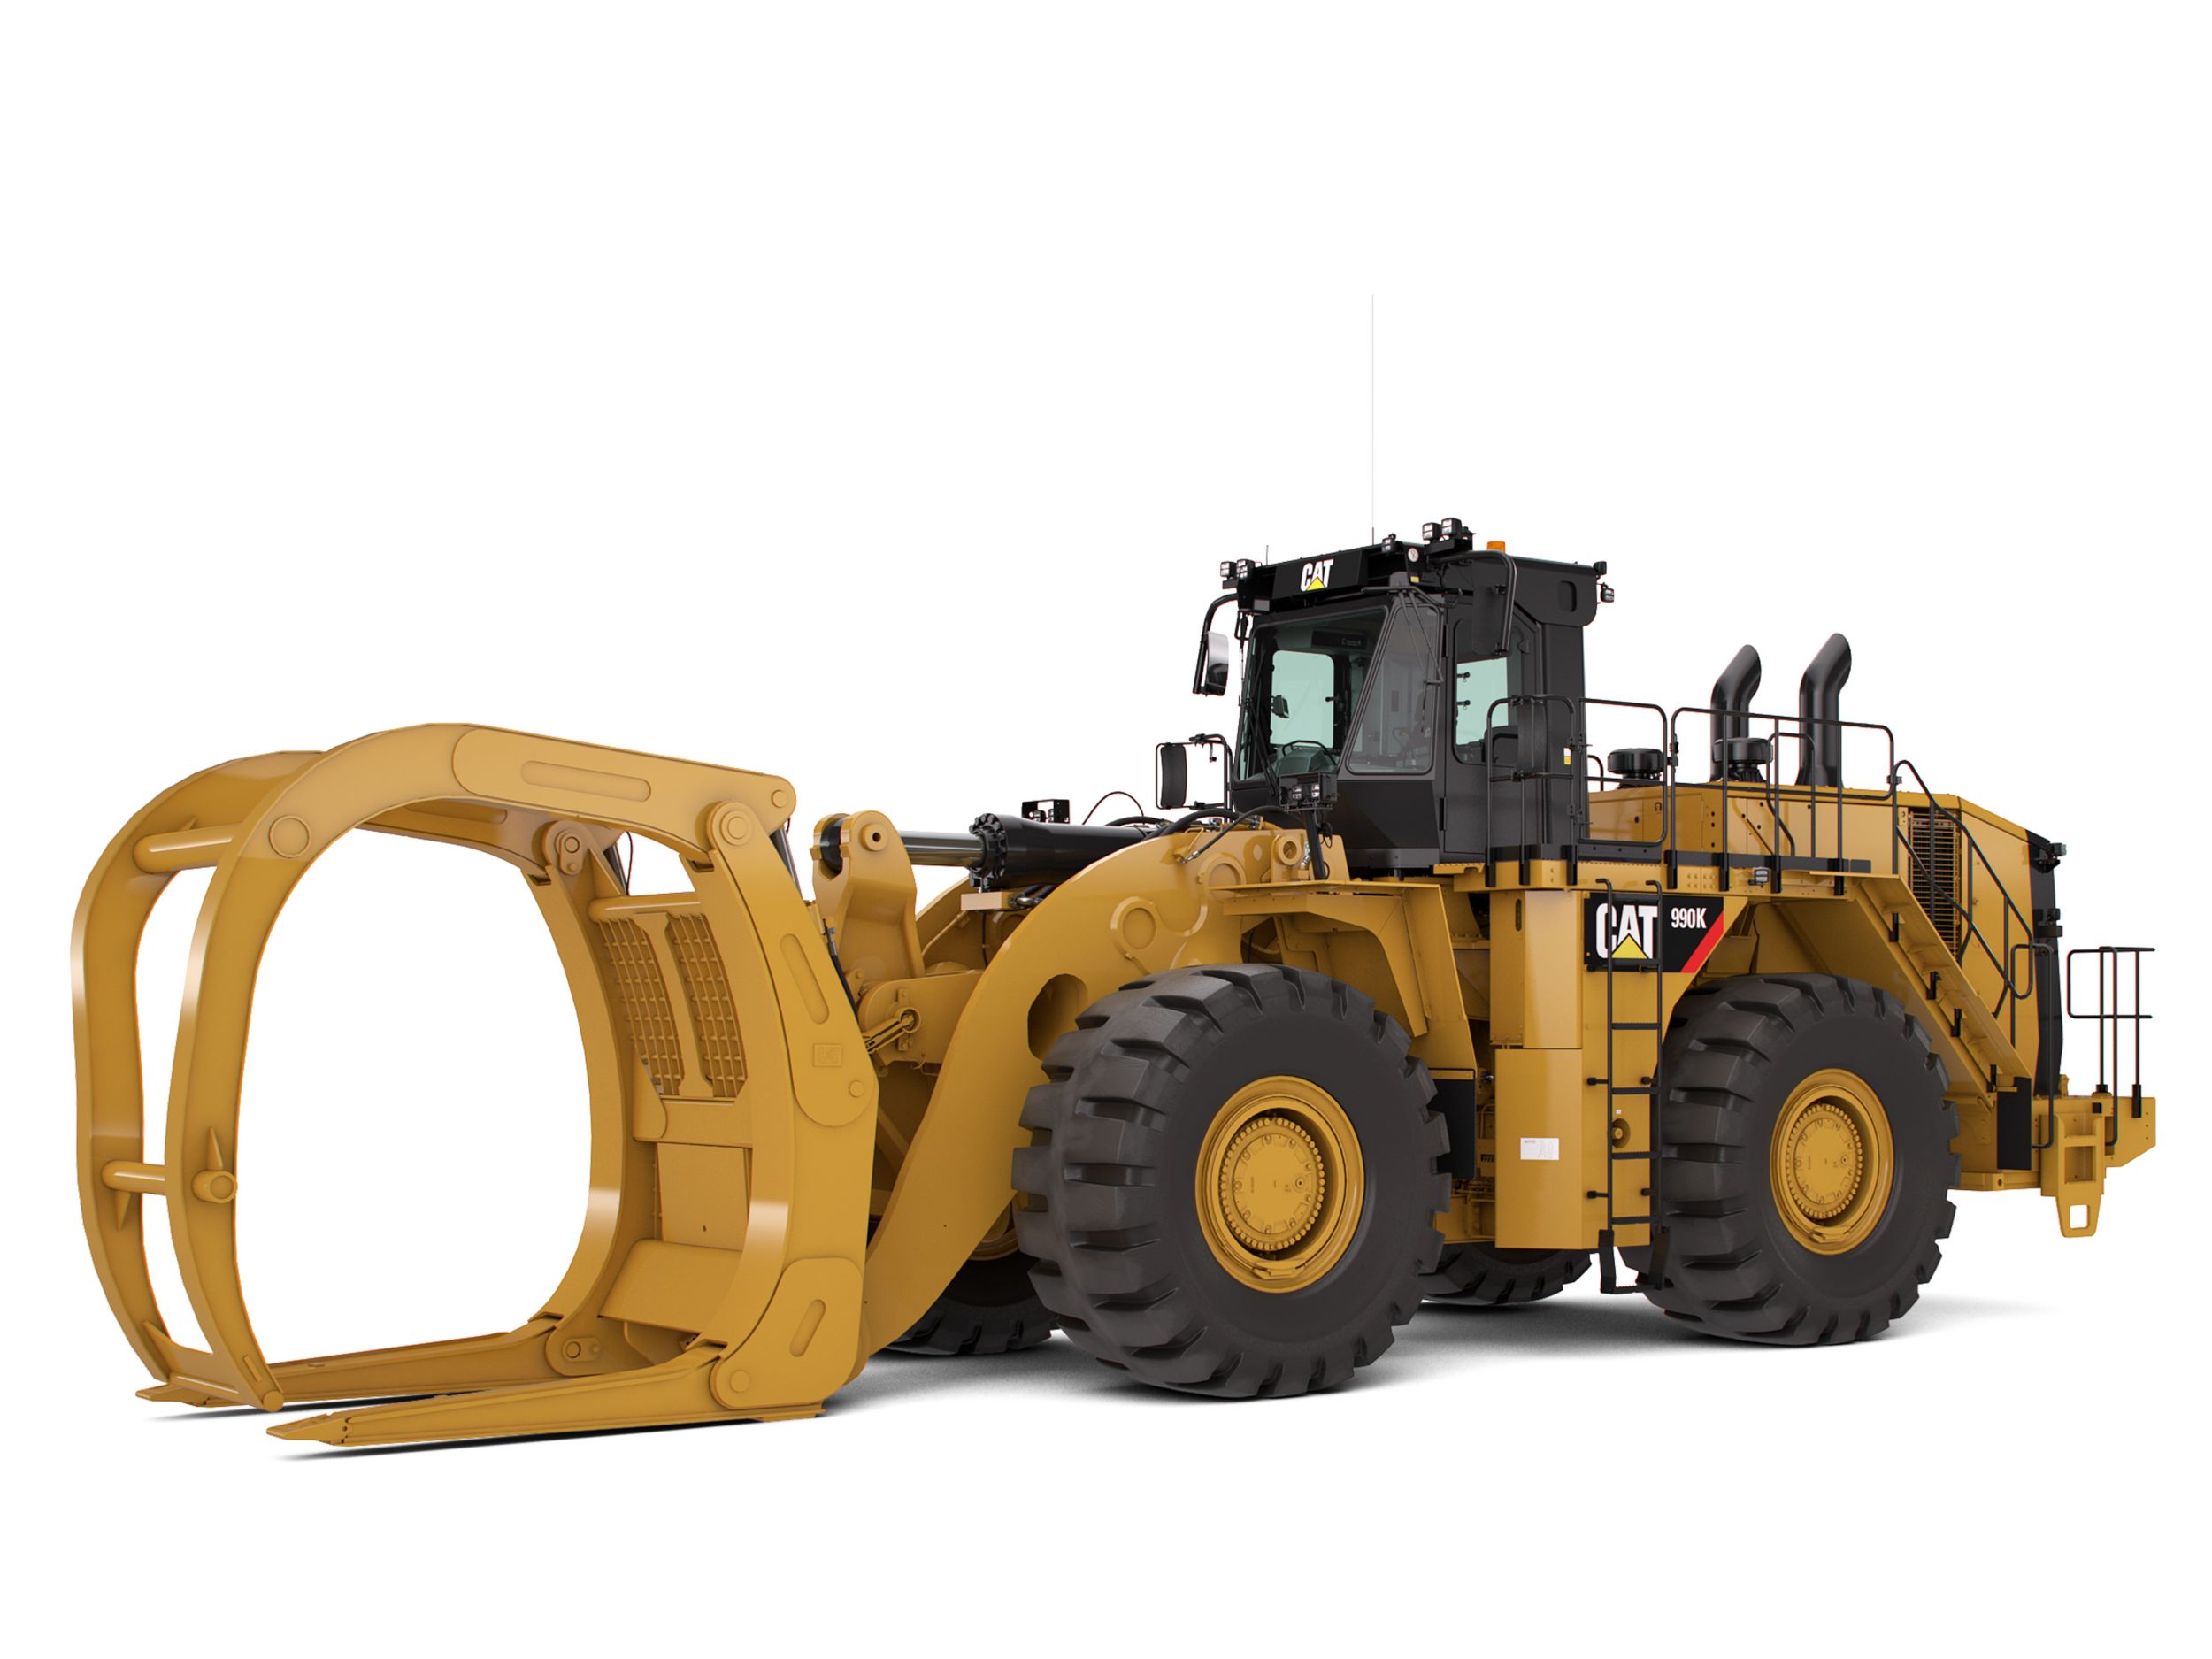
990K Millyard Arrangement
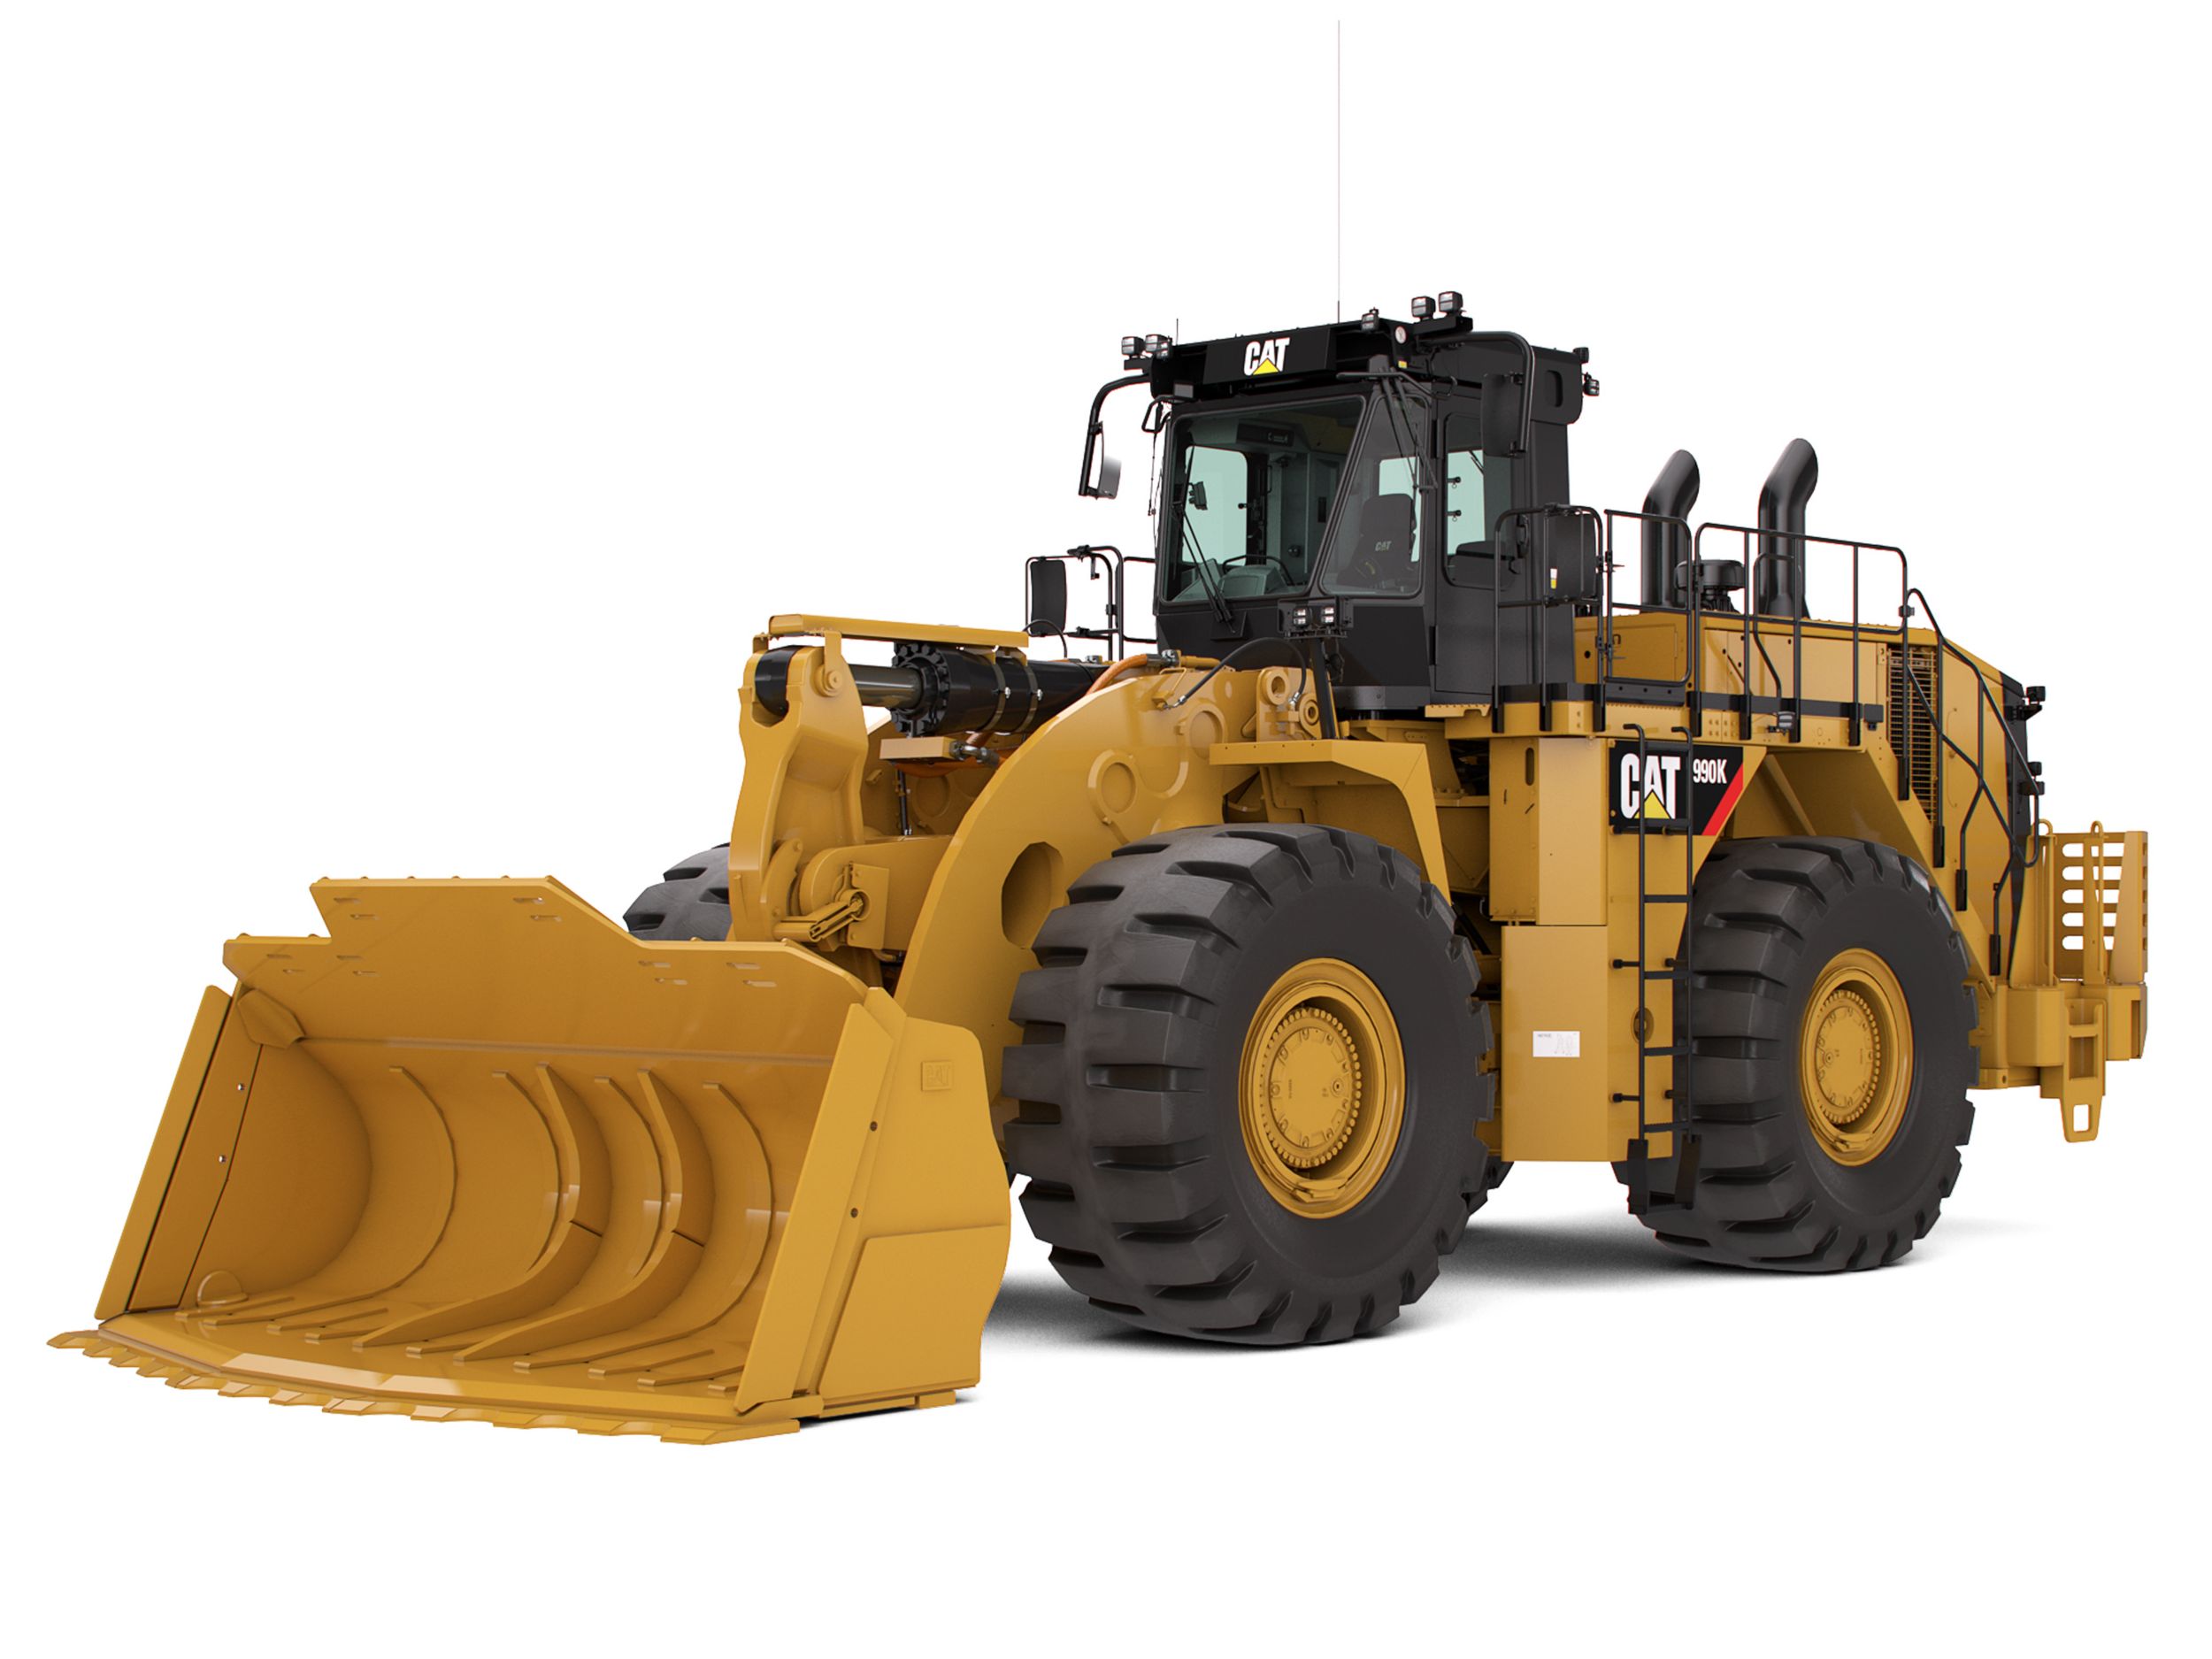
990K Steel Mill Arrangement
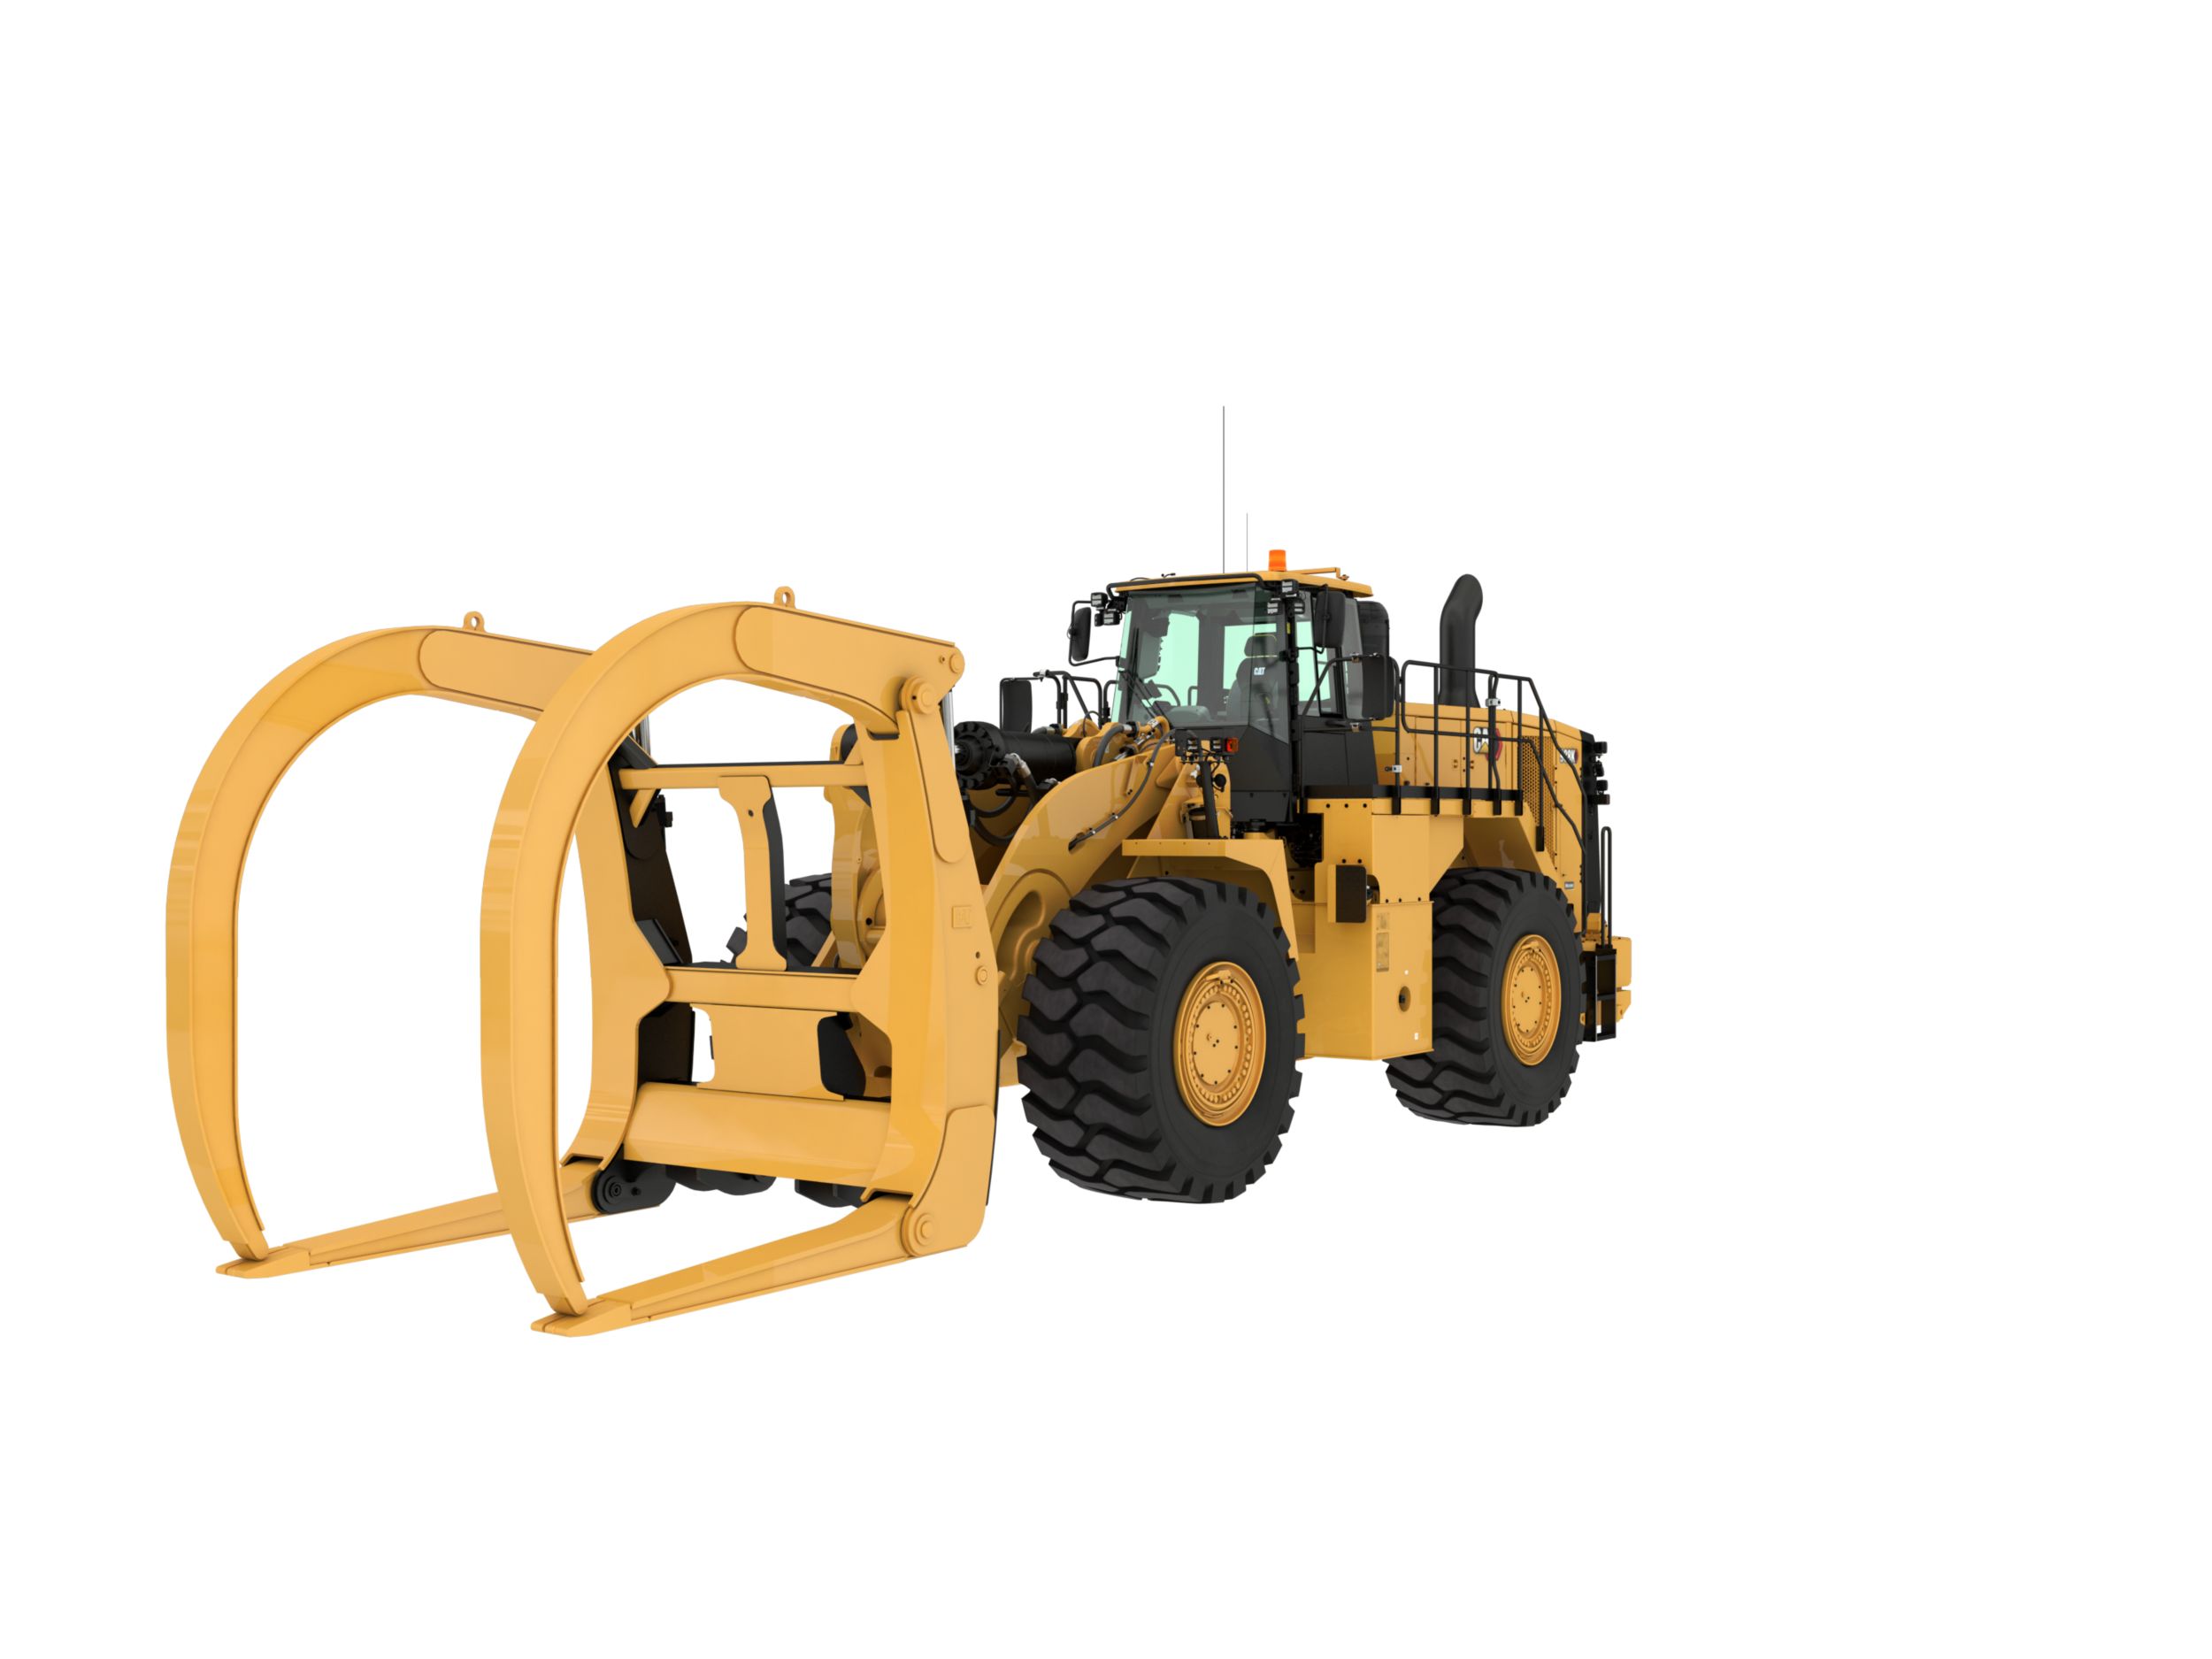
988K Millyard Arrangement
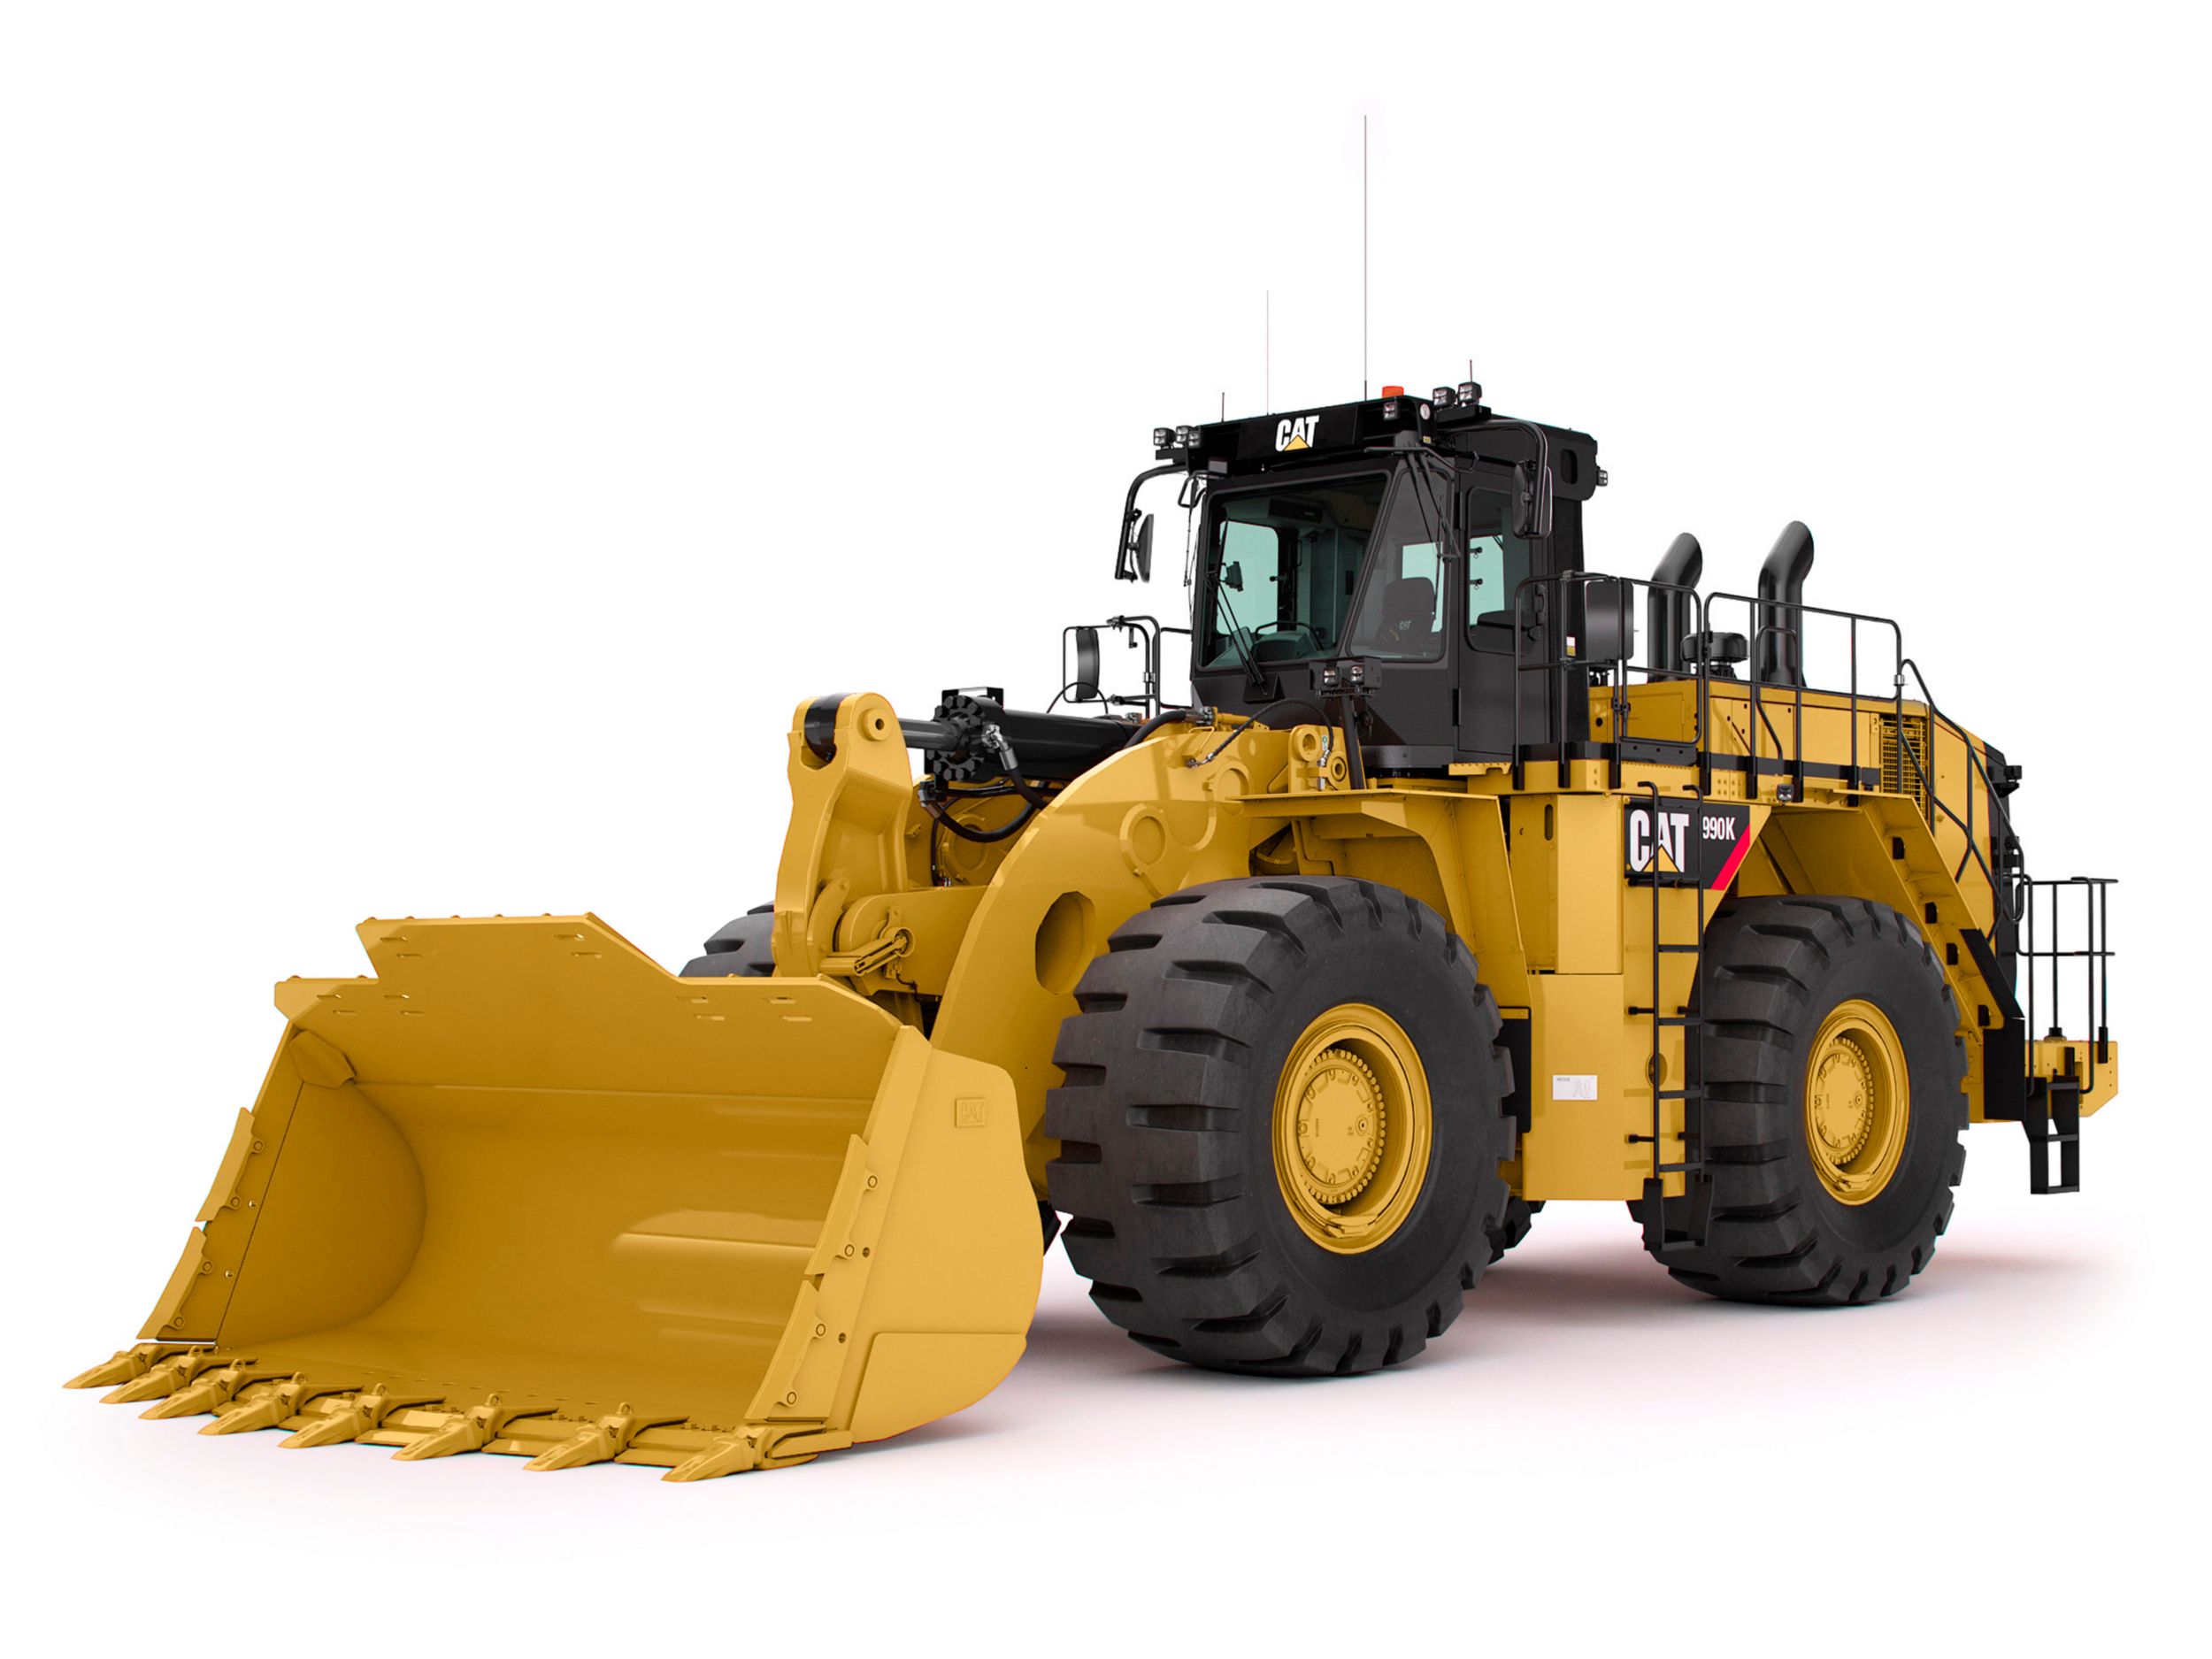
990K
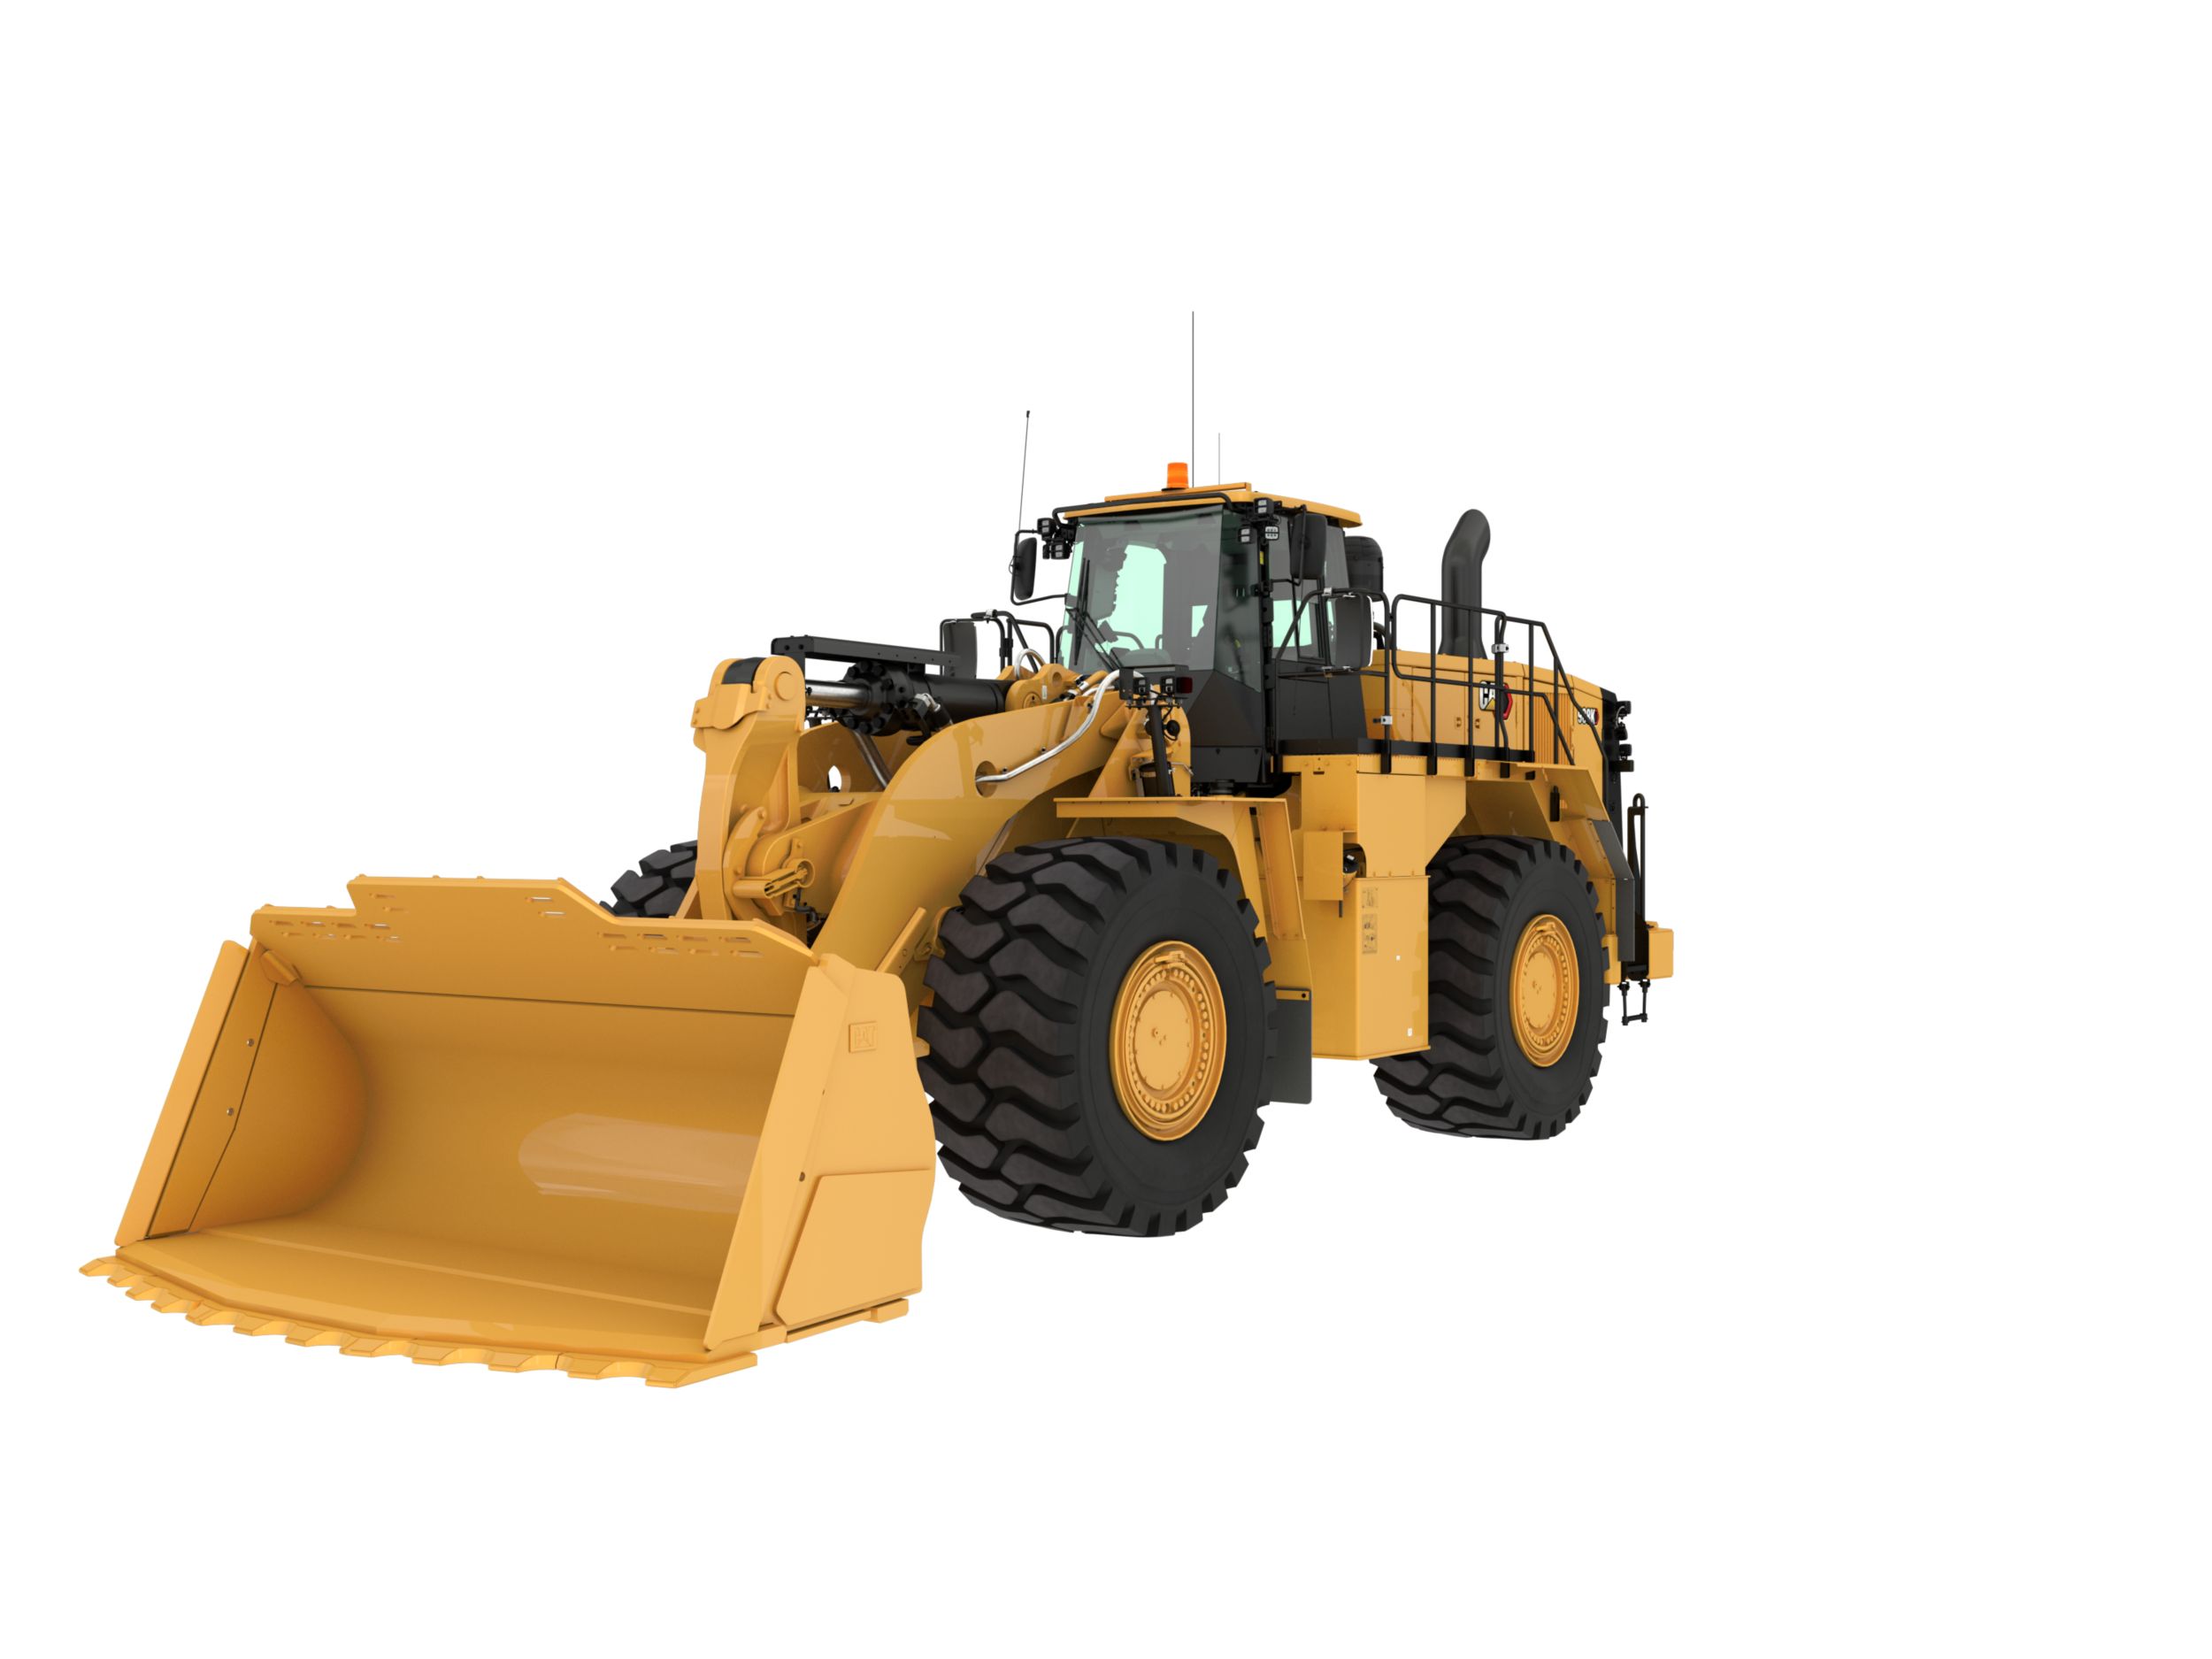
988K Steel Mill Arrangement
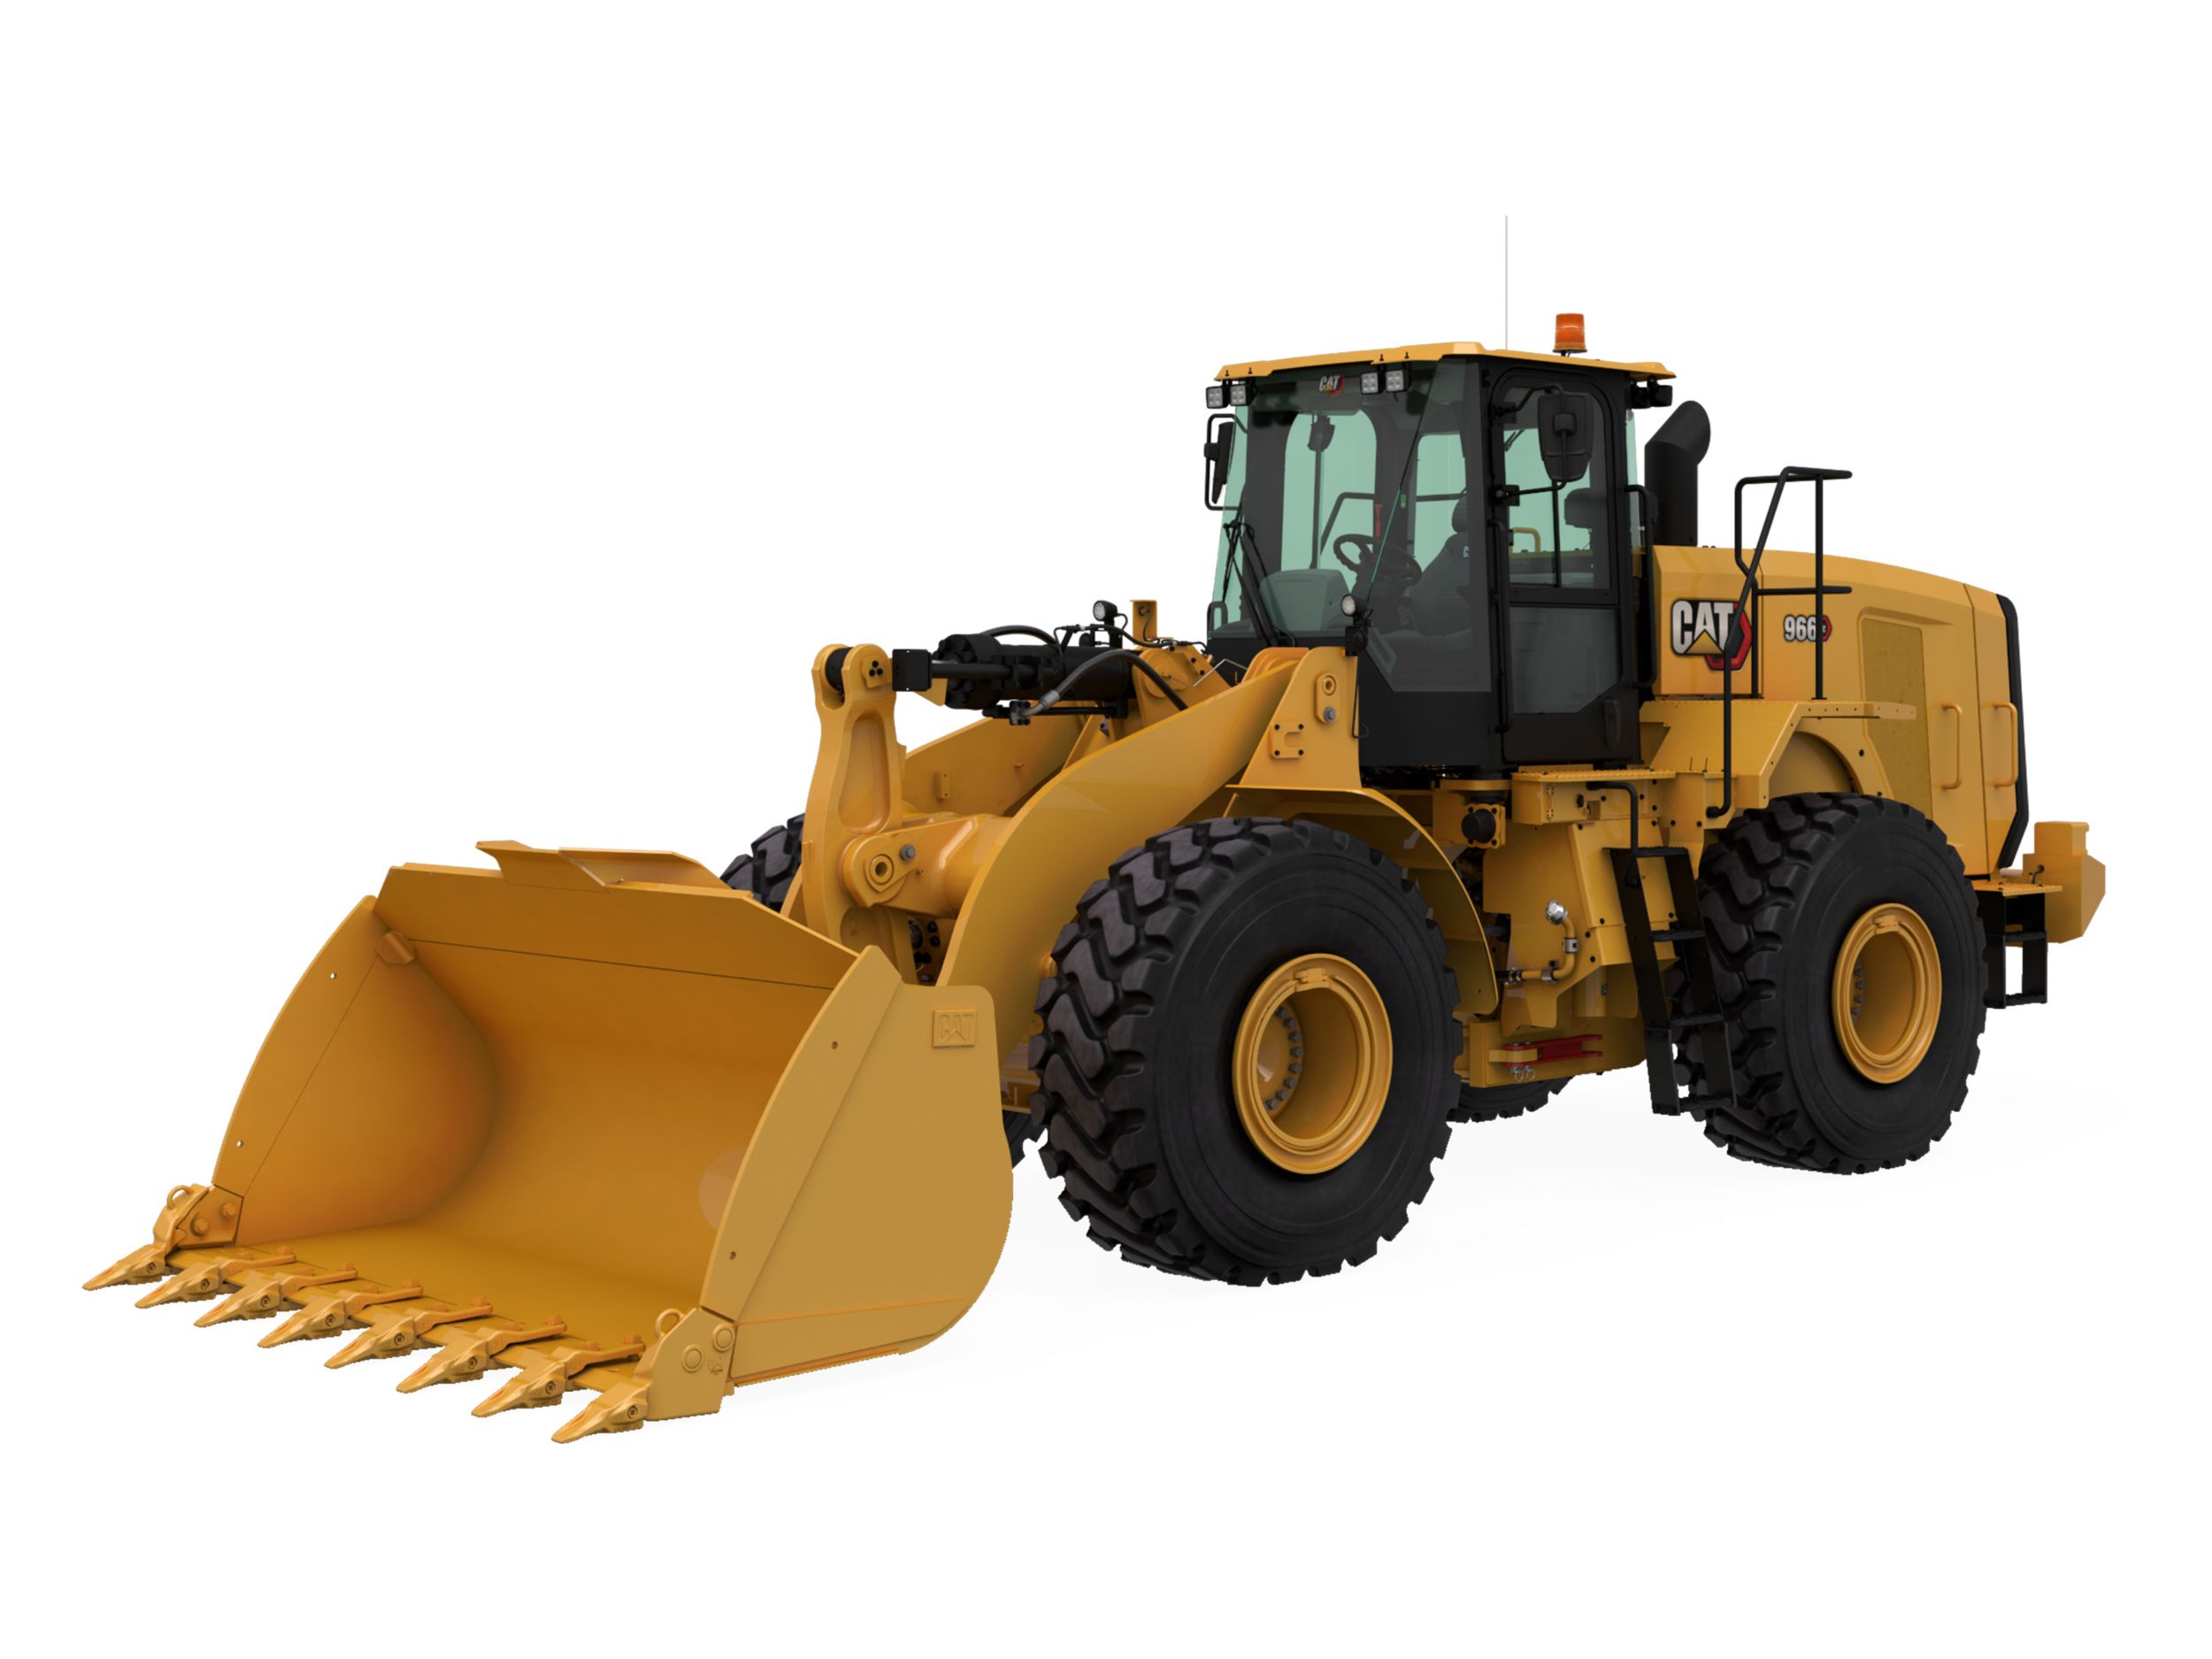
966 GC
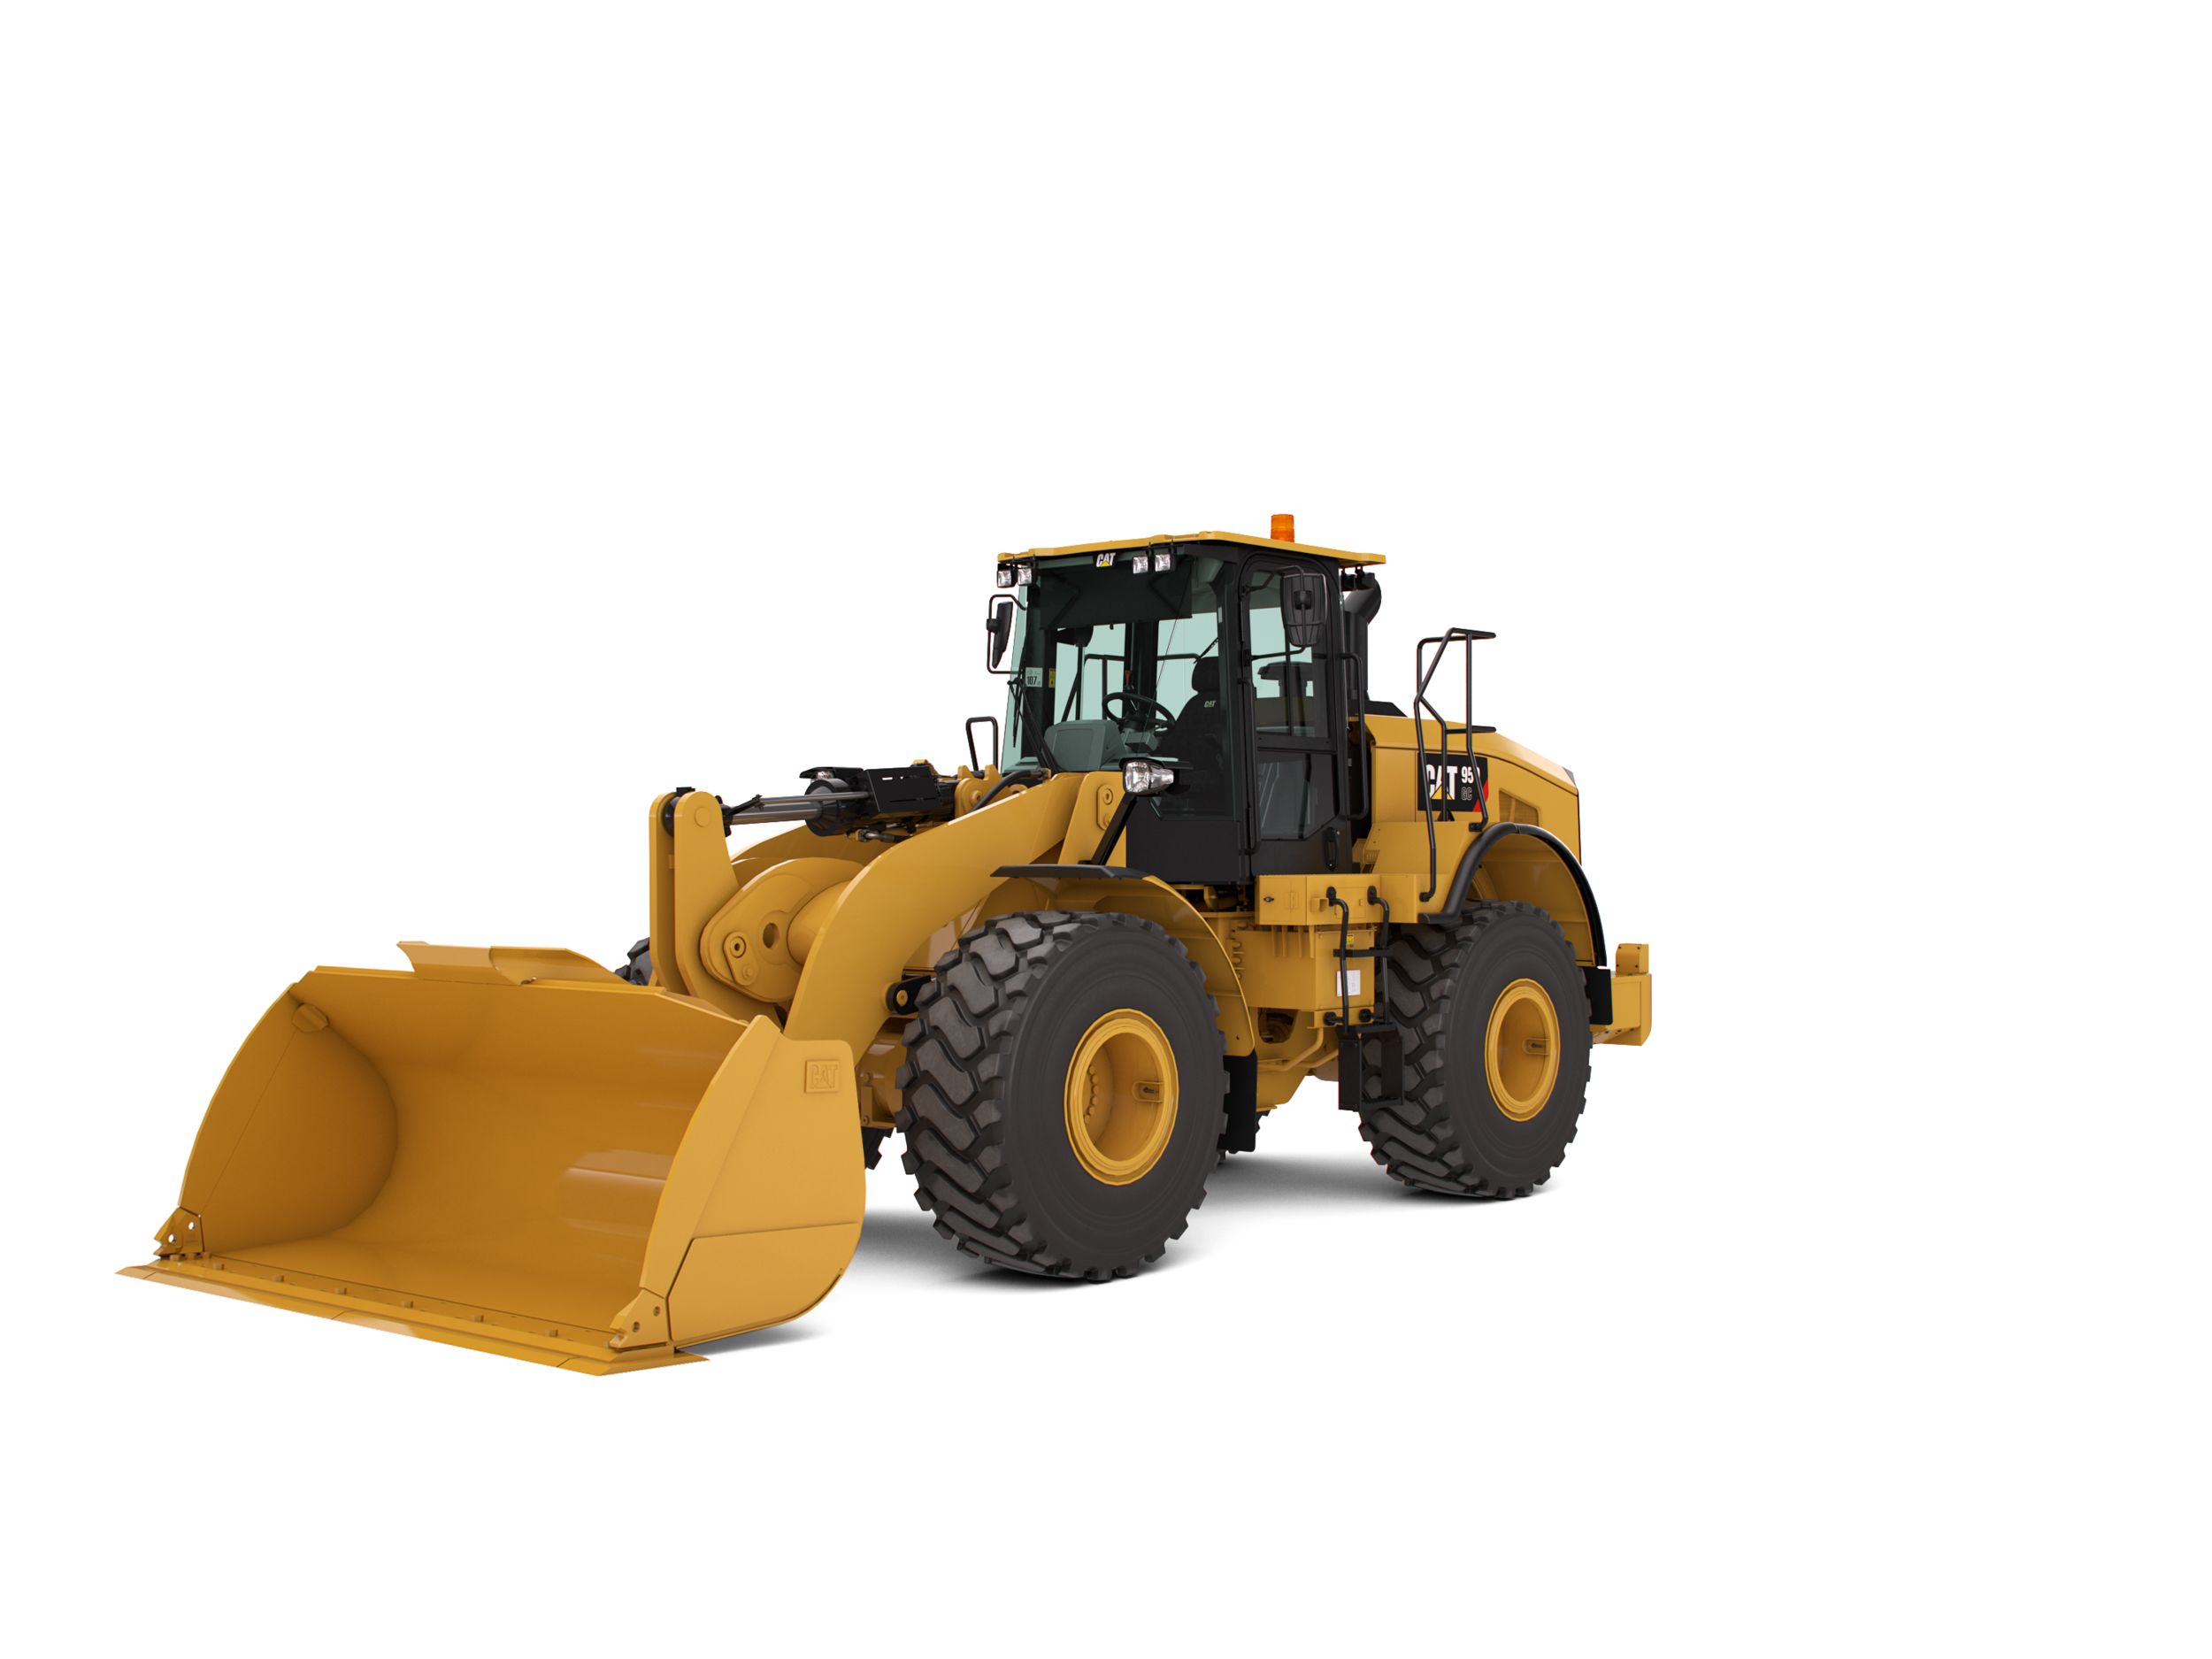
950 GC

VisionLink®
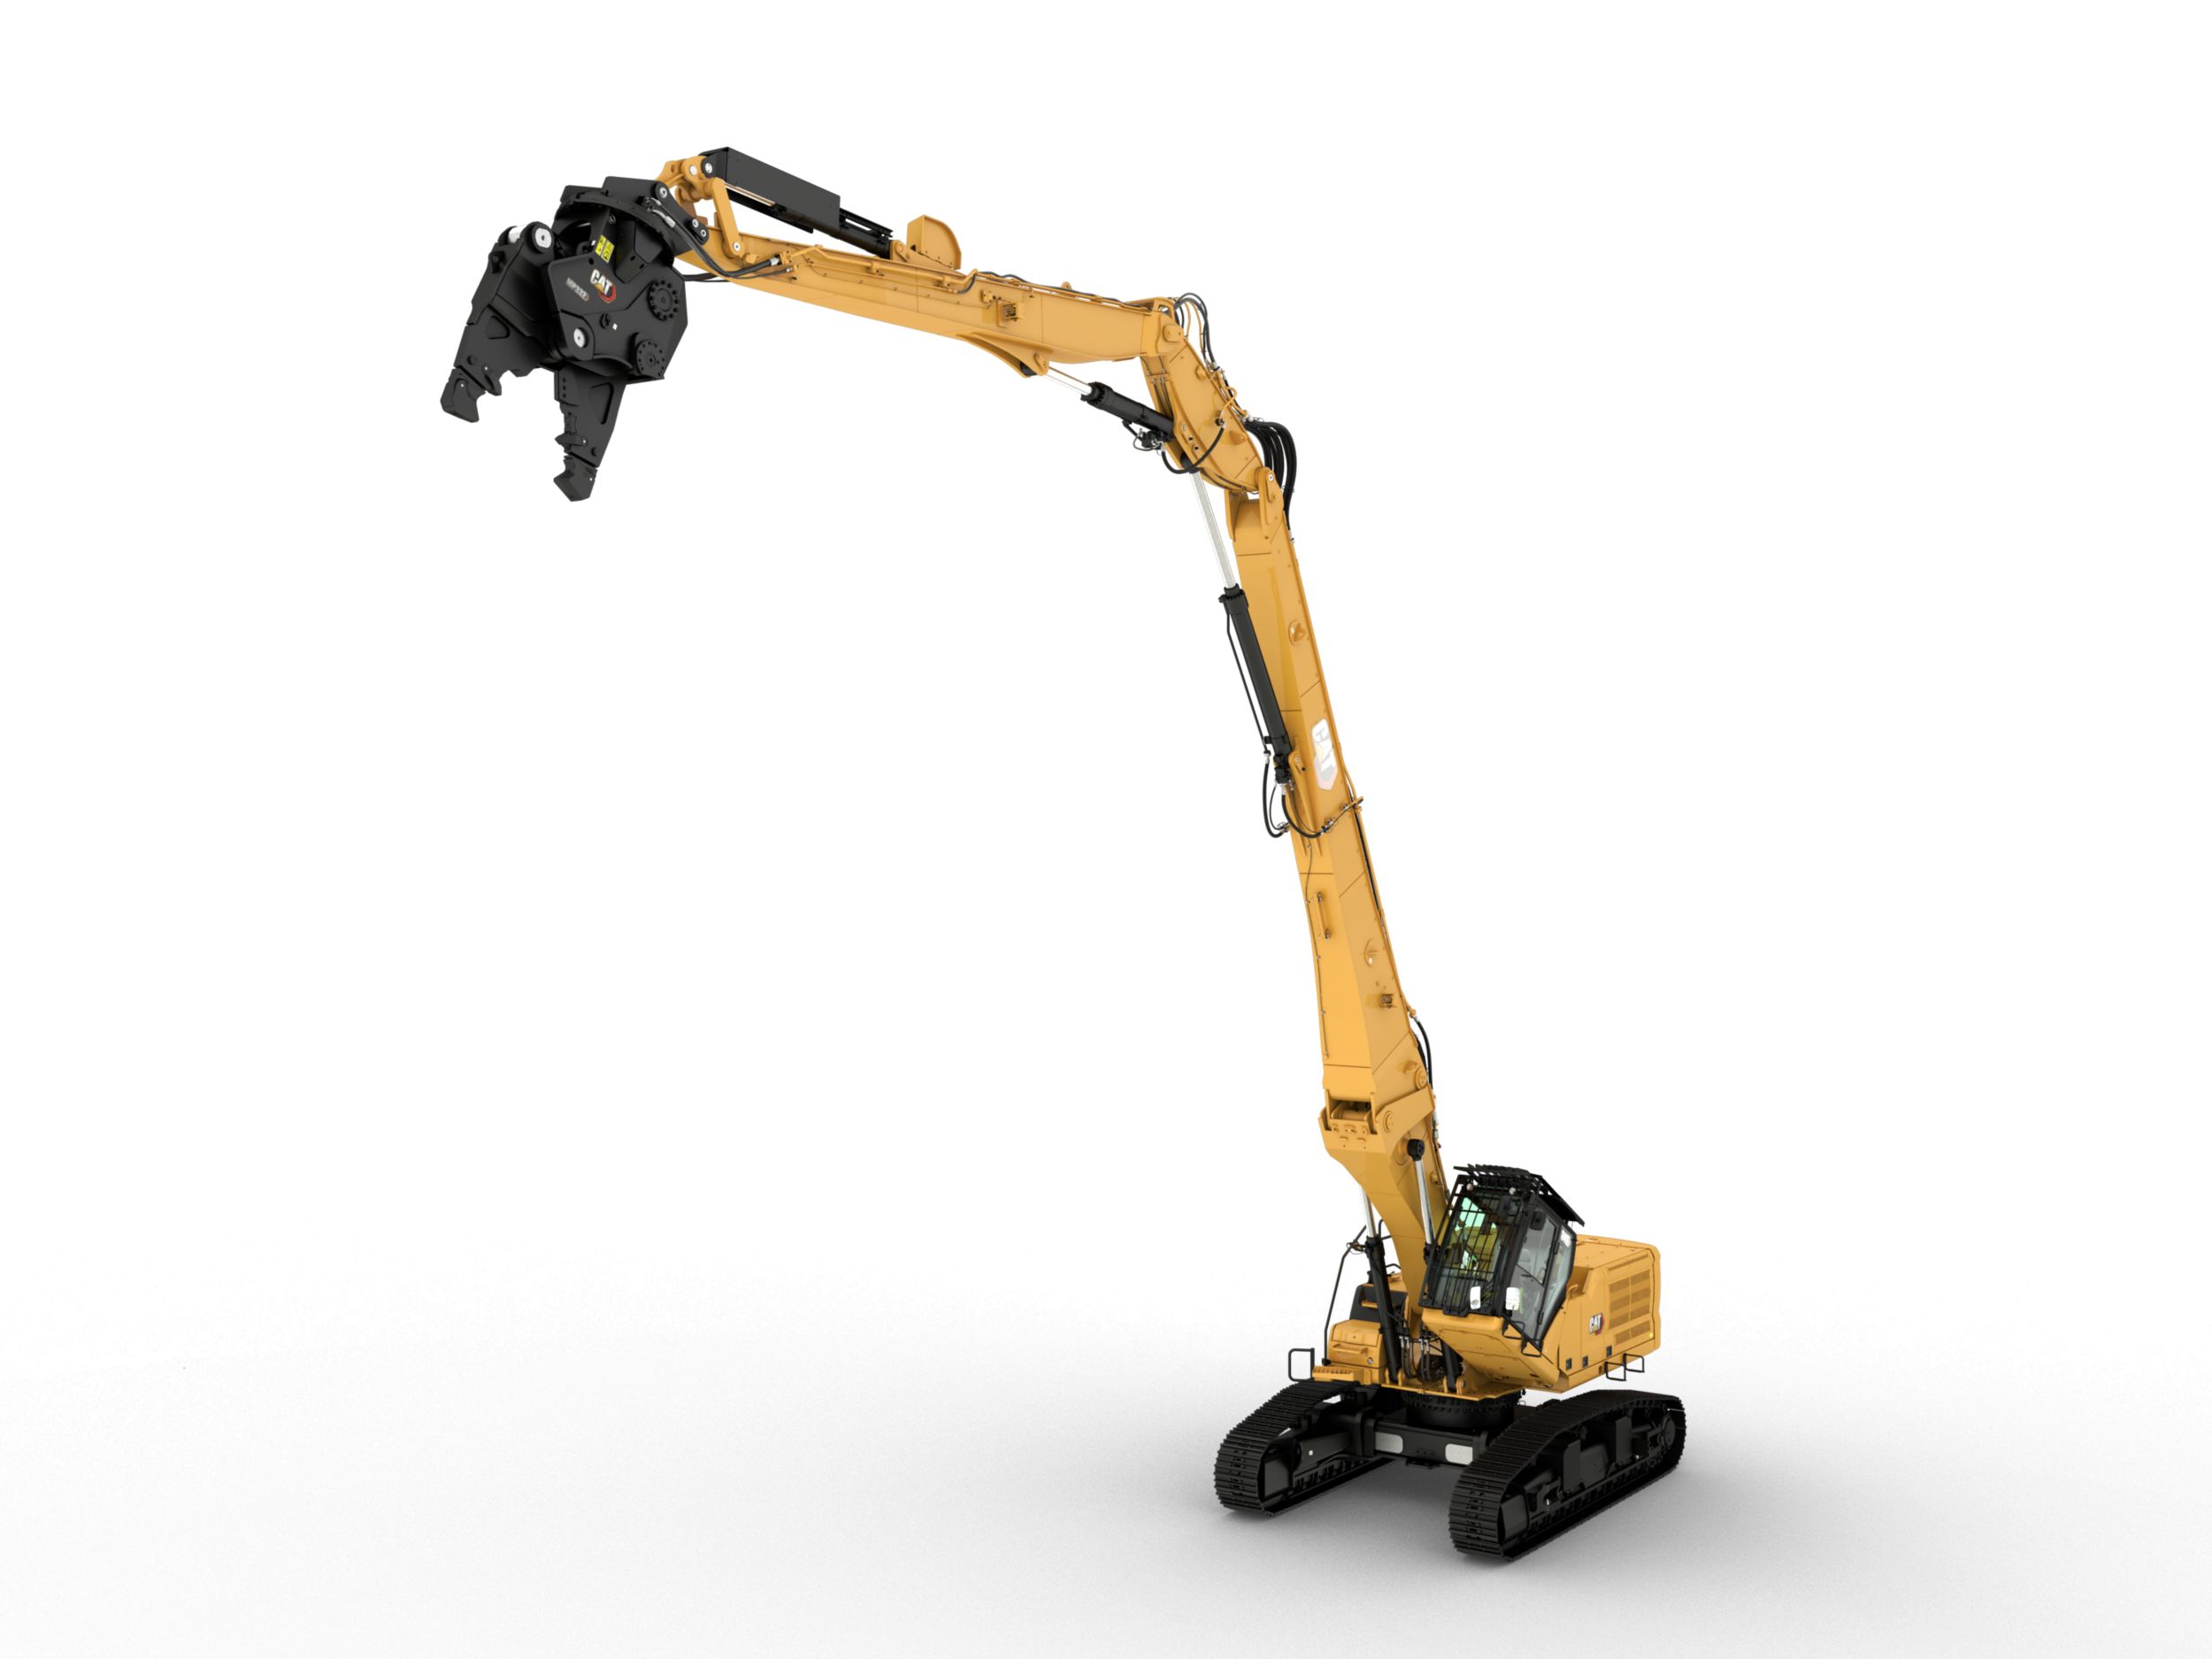
340 UHD
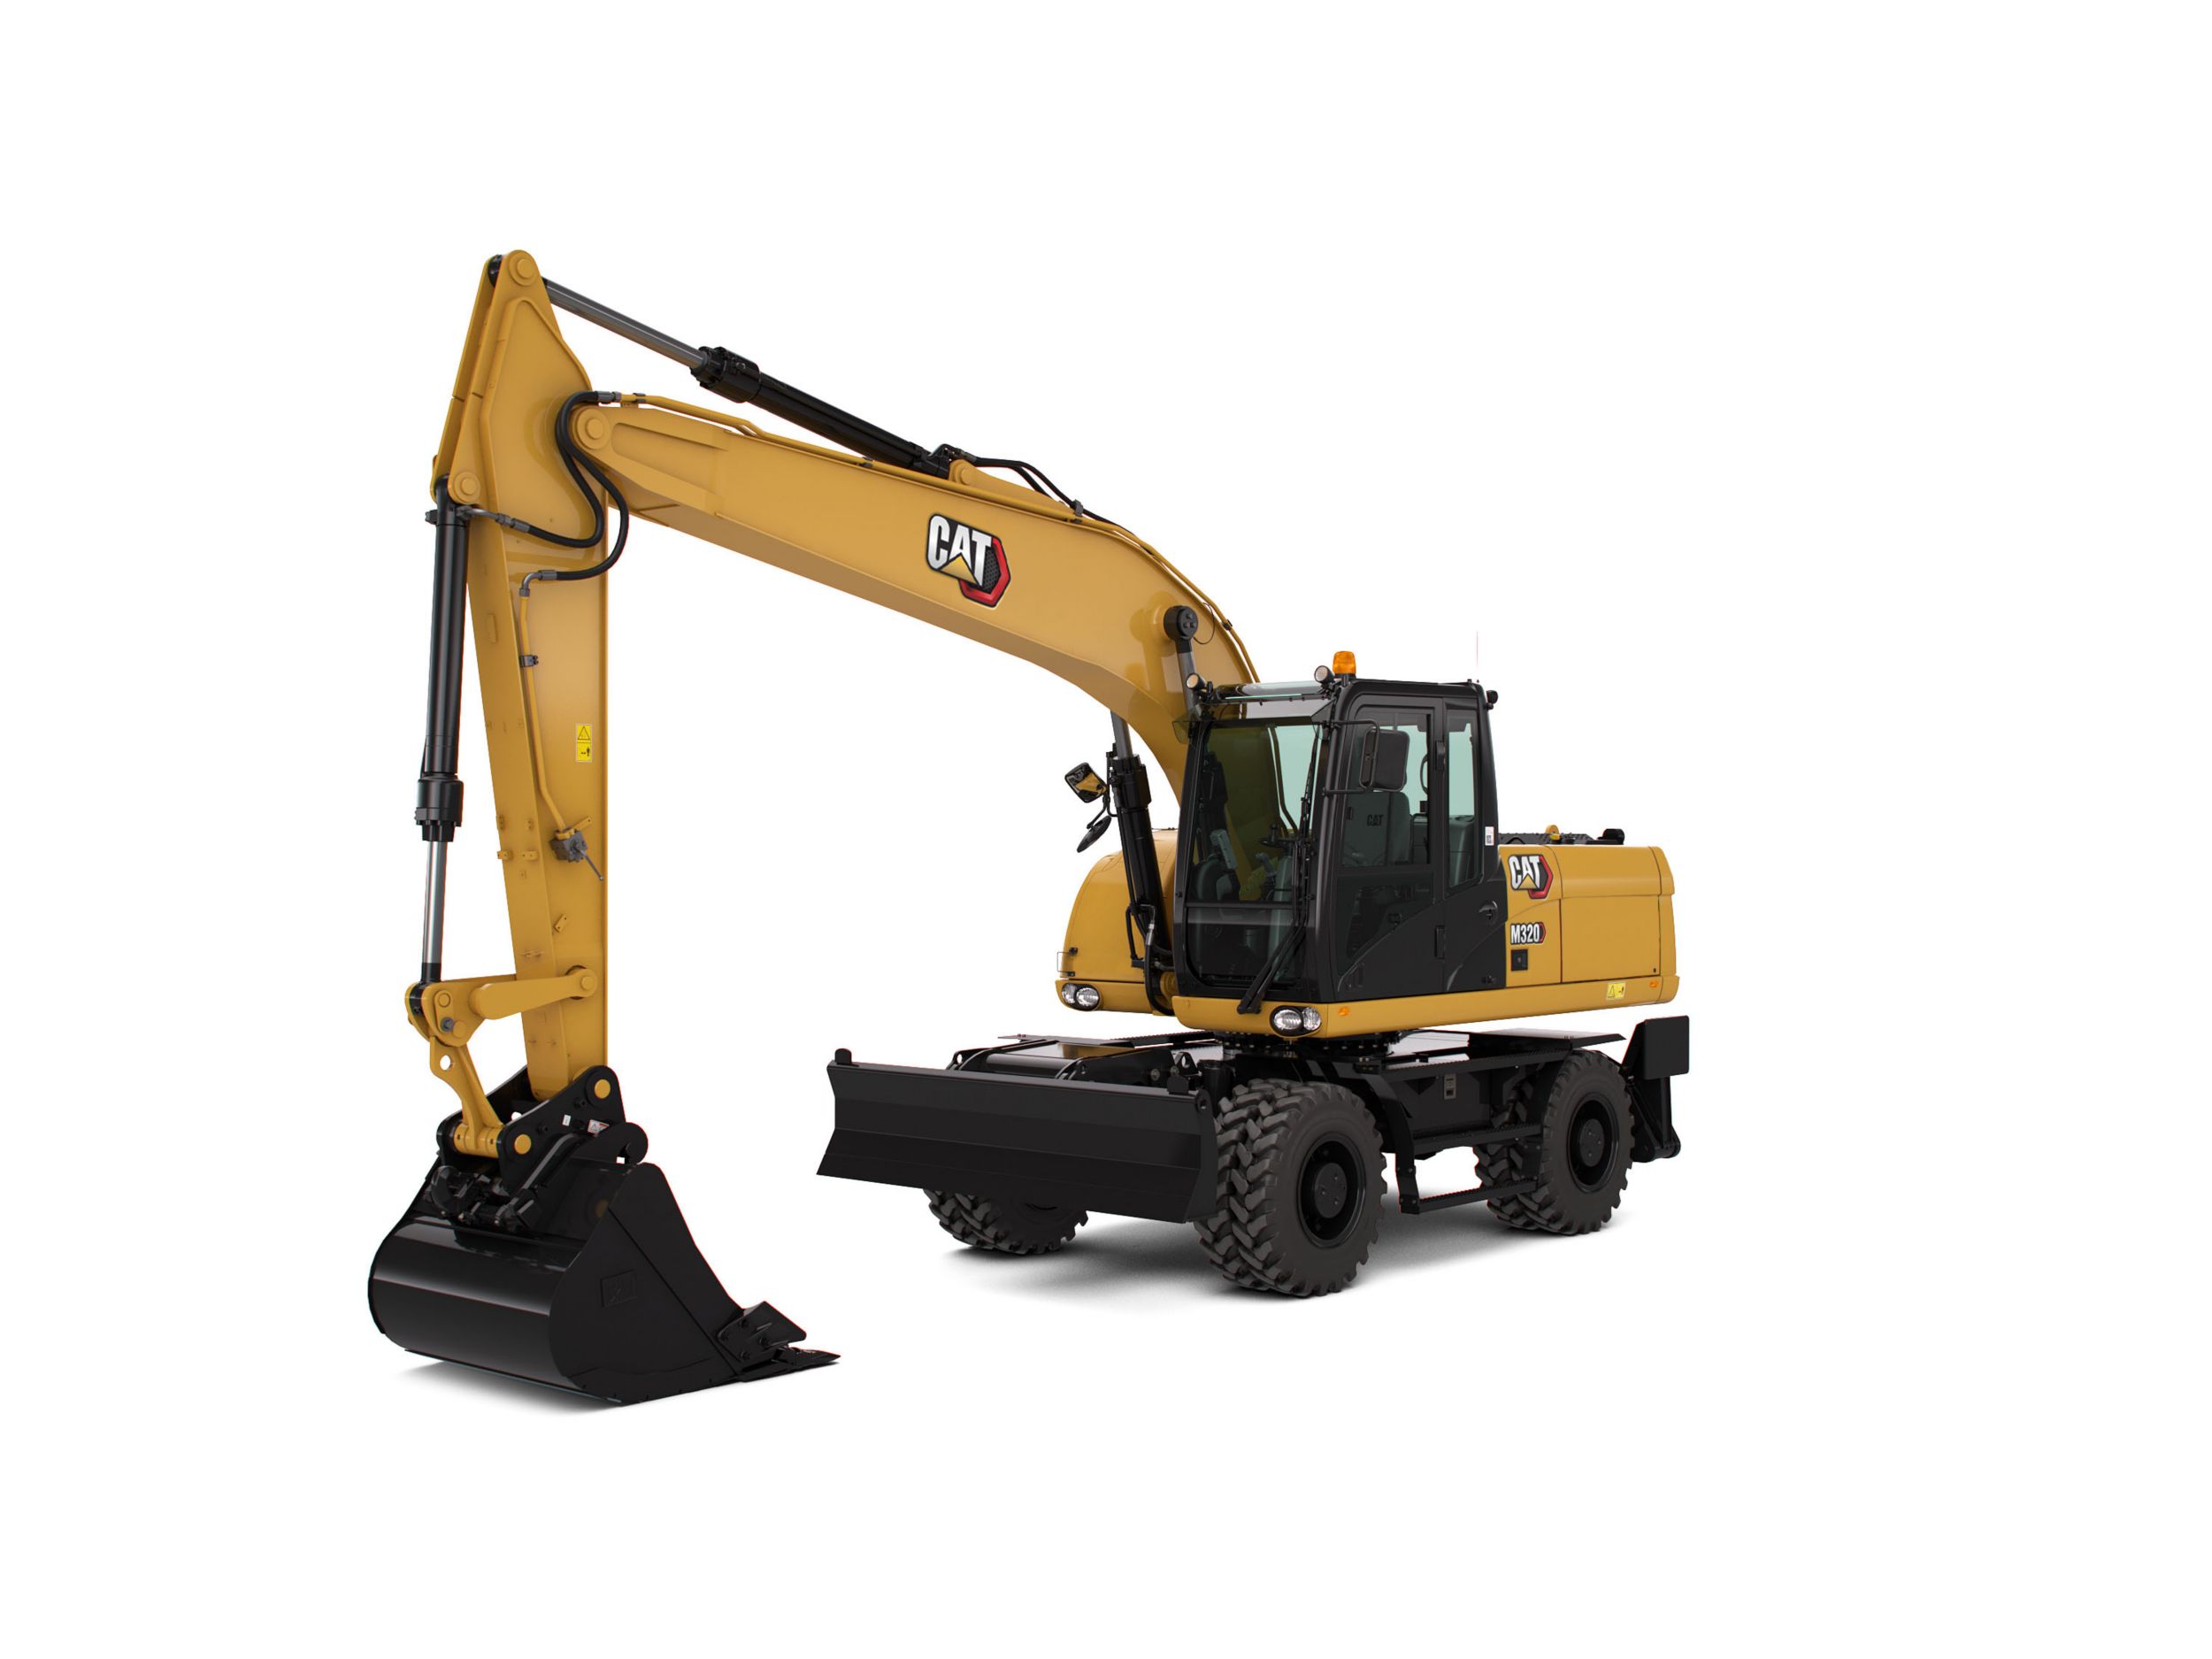
M320

745
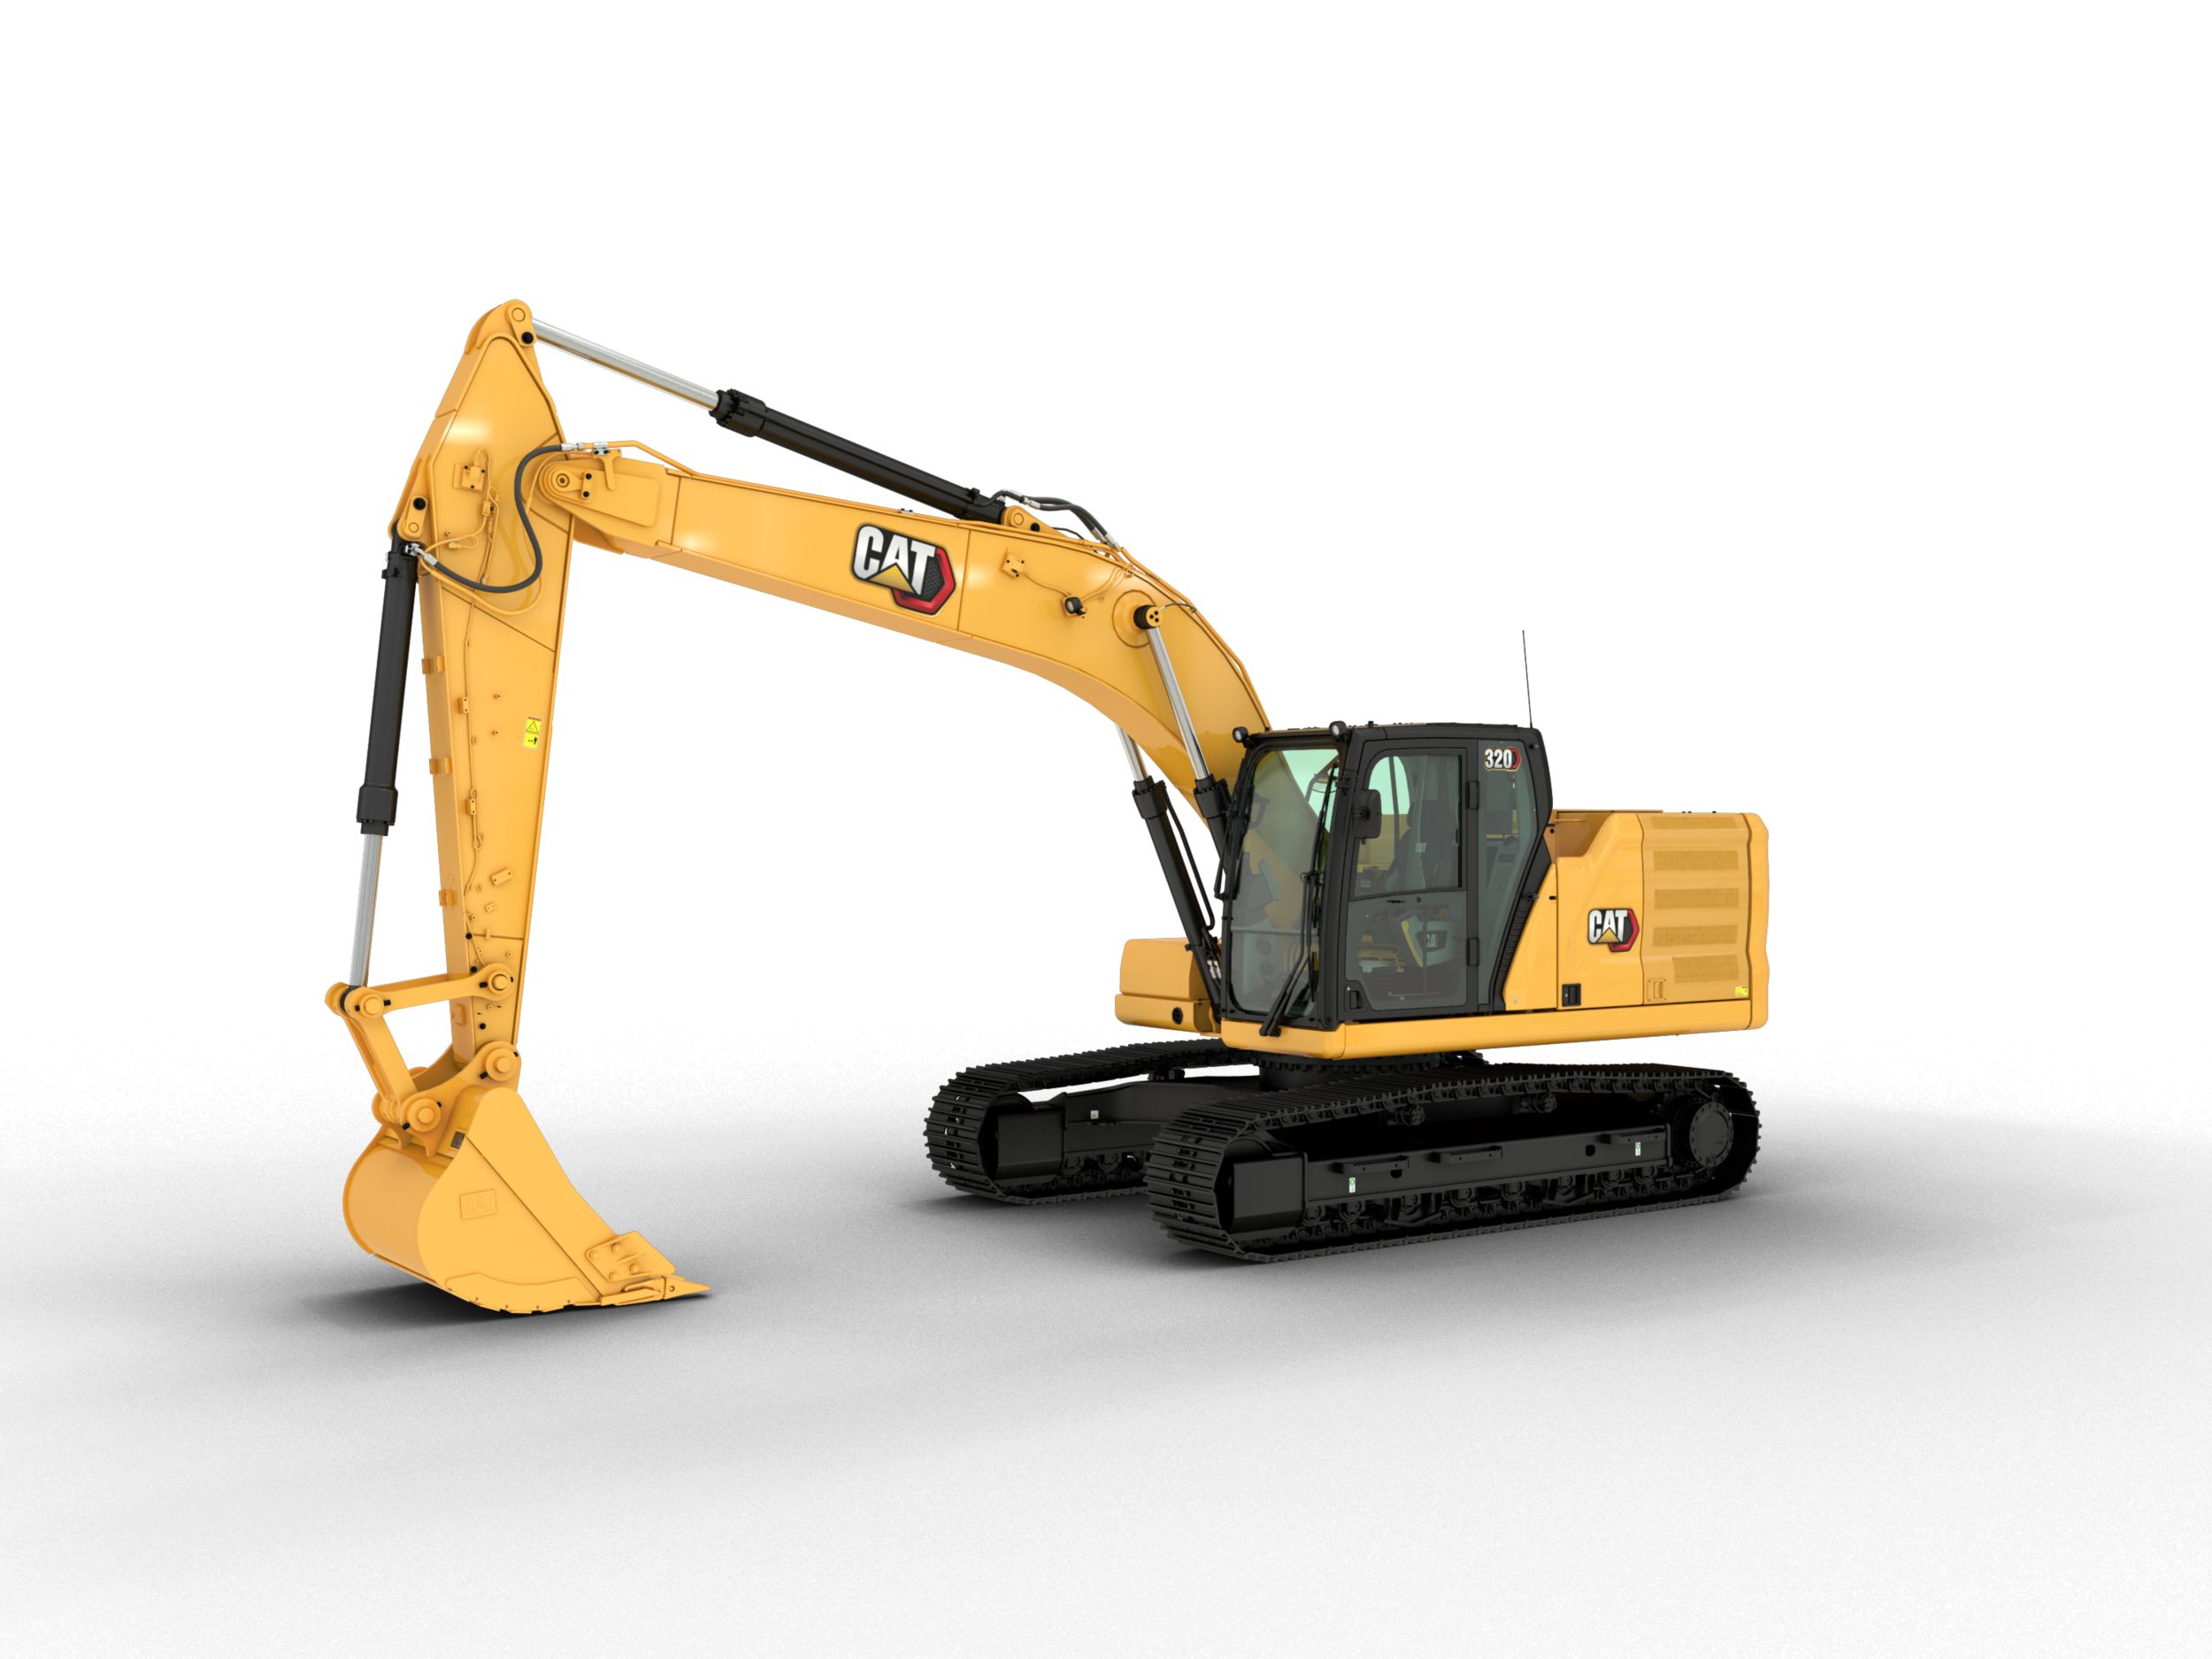
320 - Tier 3
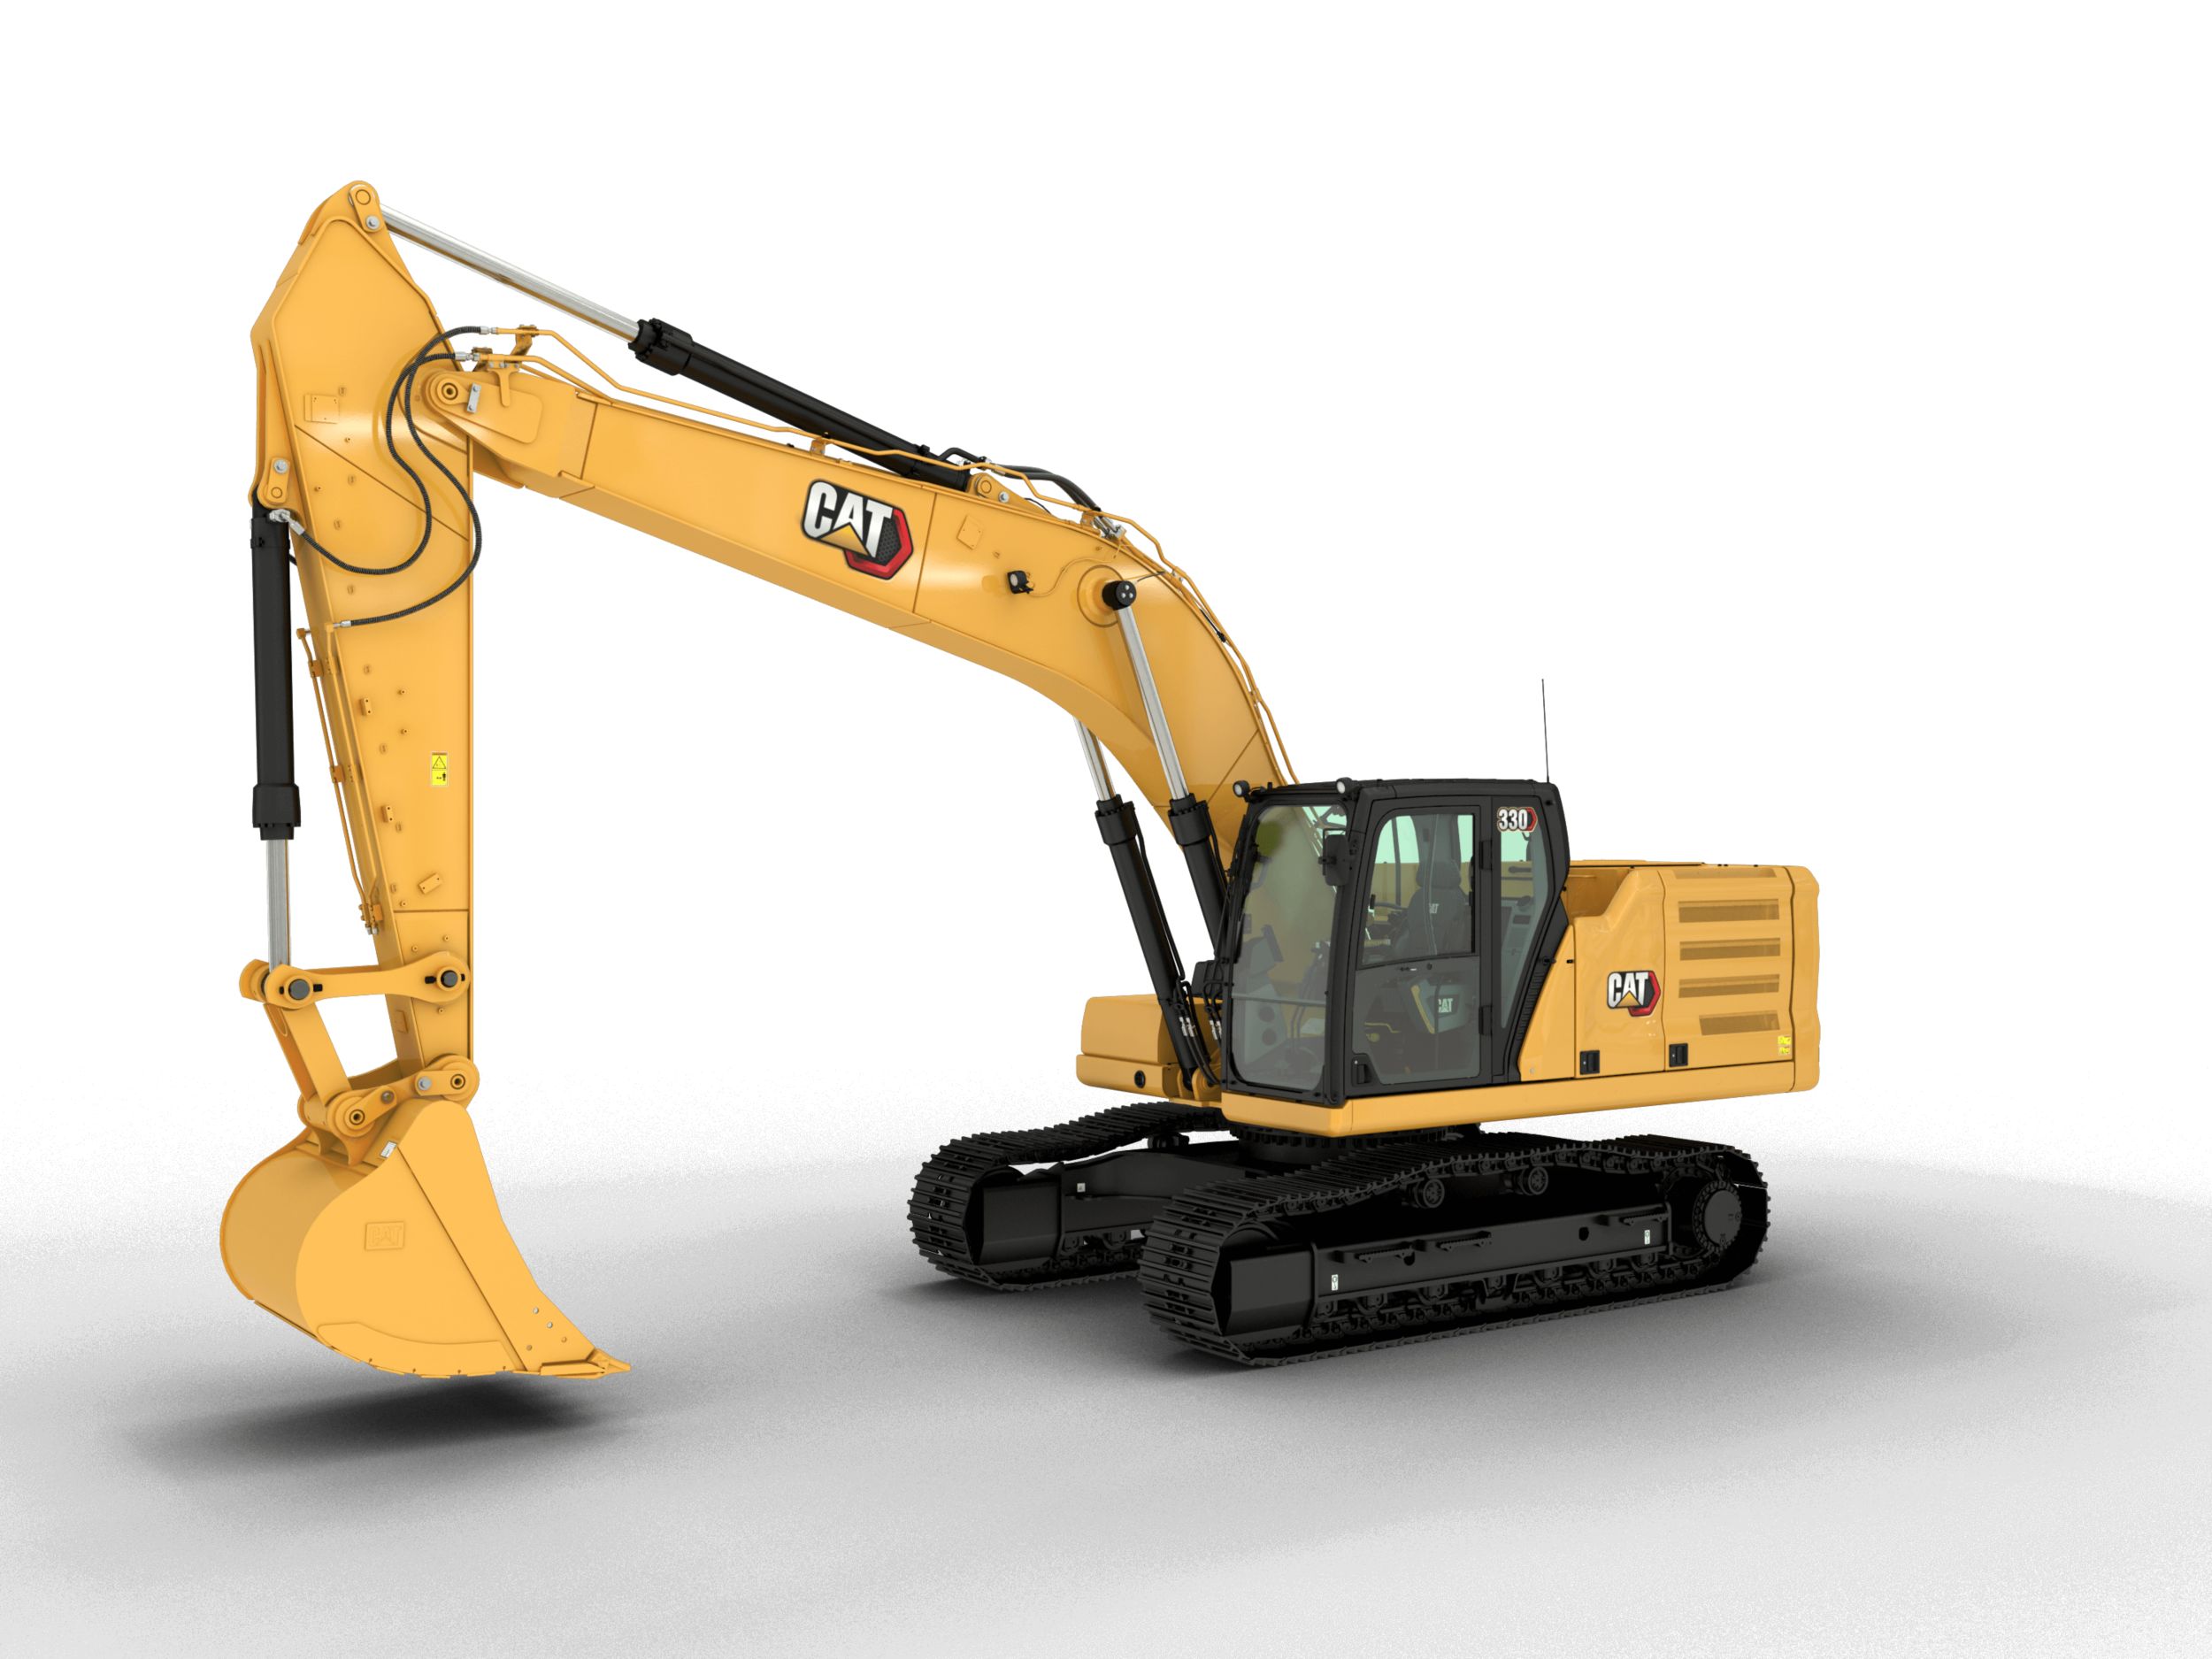
330 - Tier 3
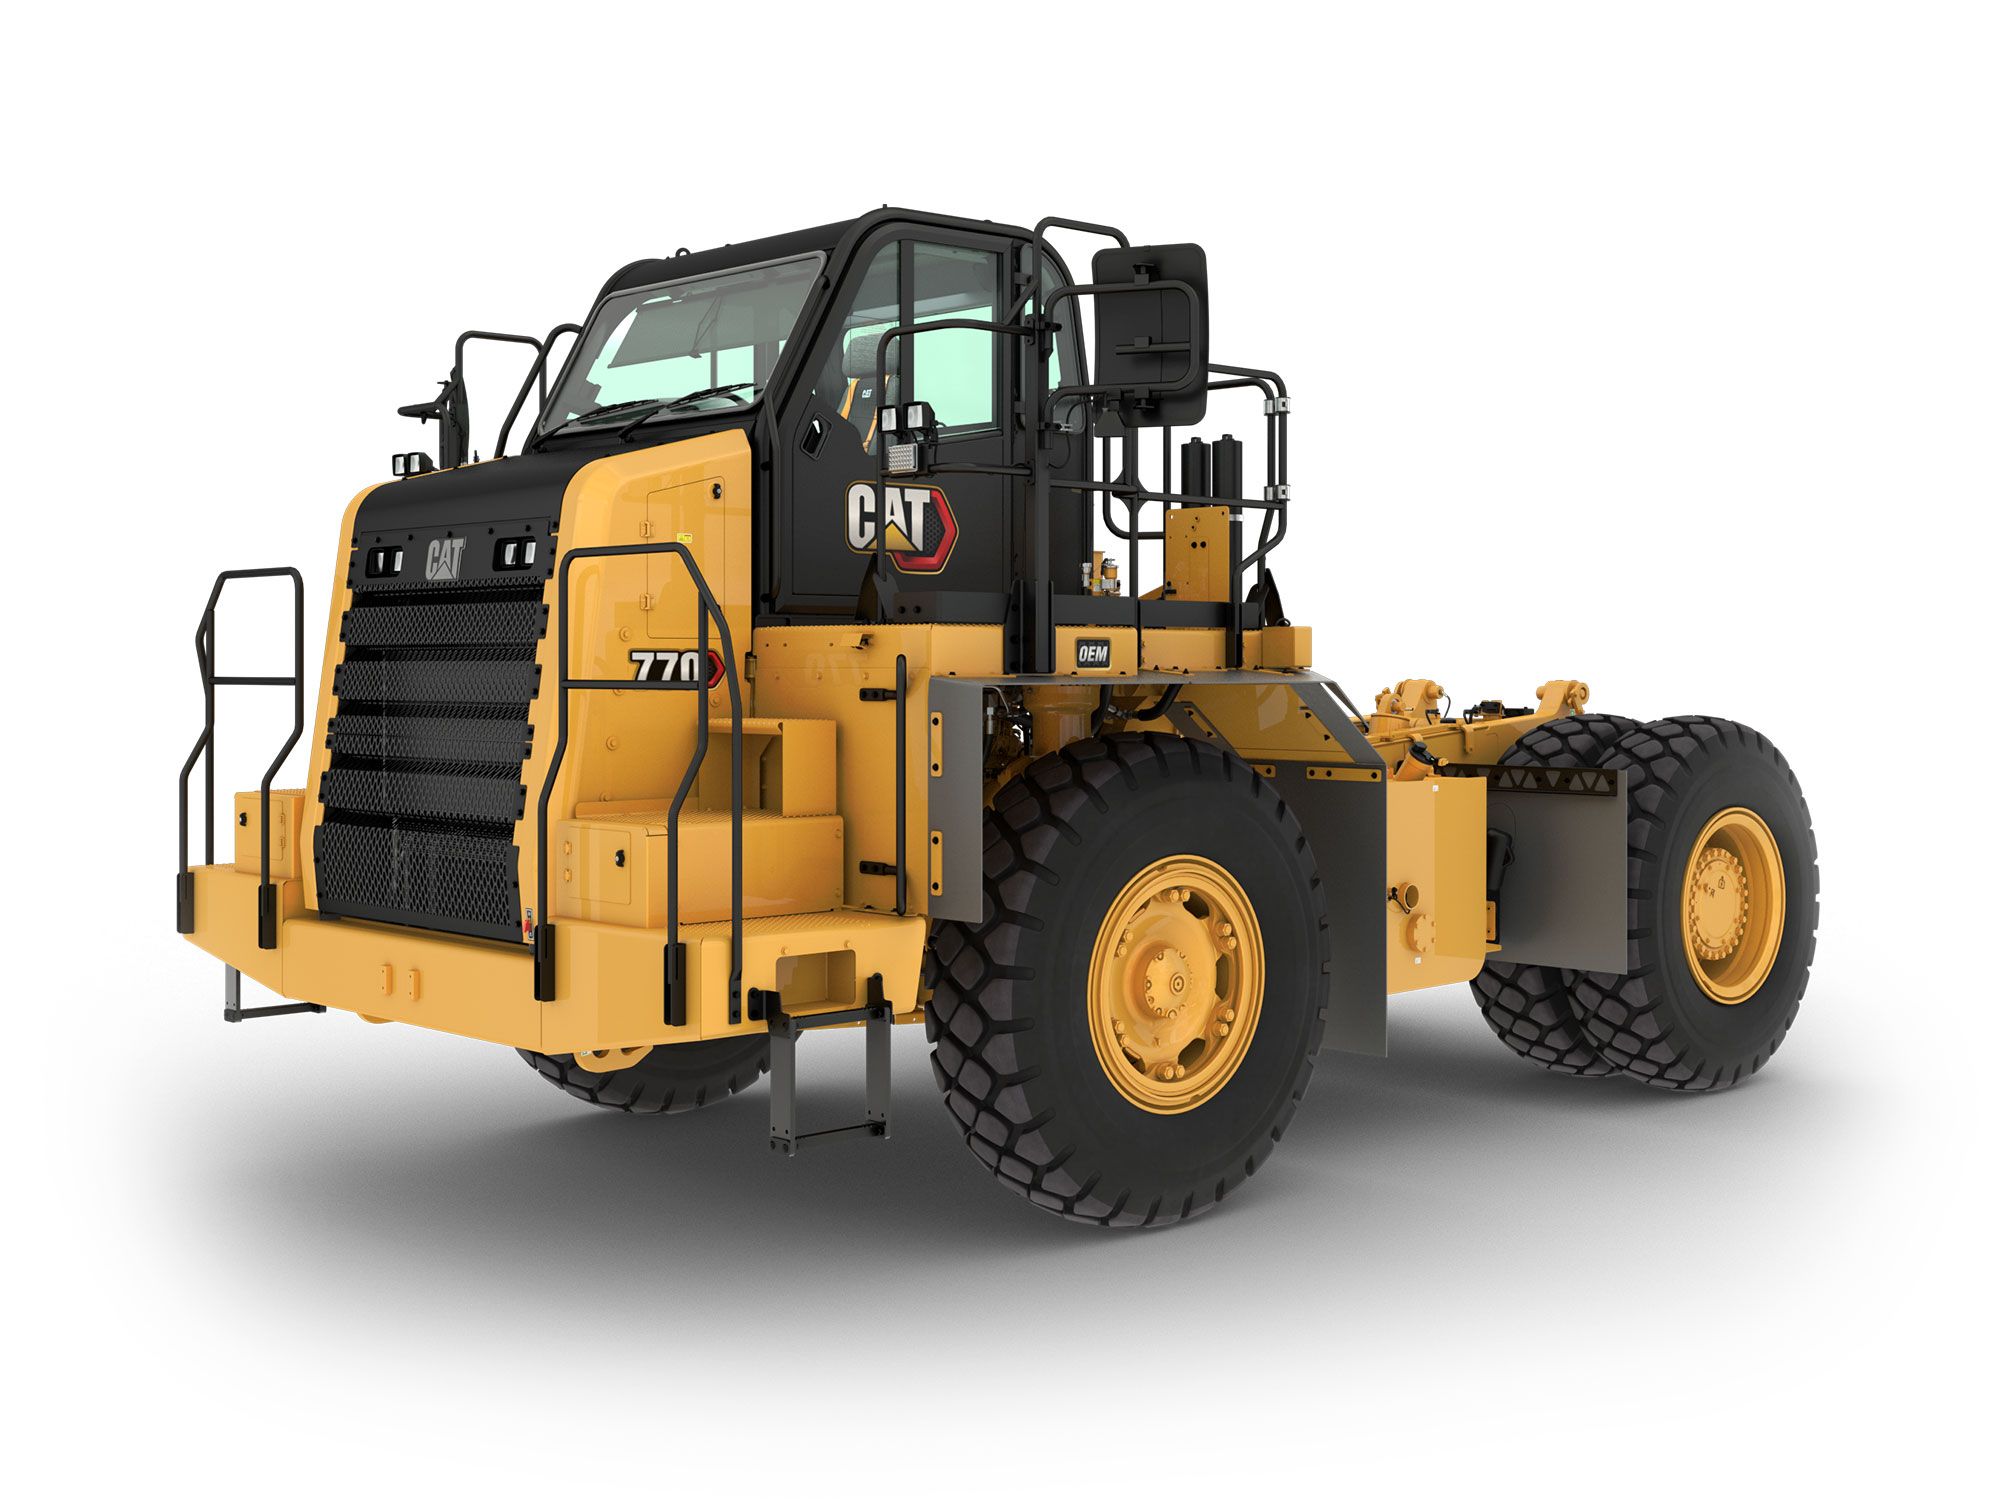
770 Bare Chassis
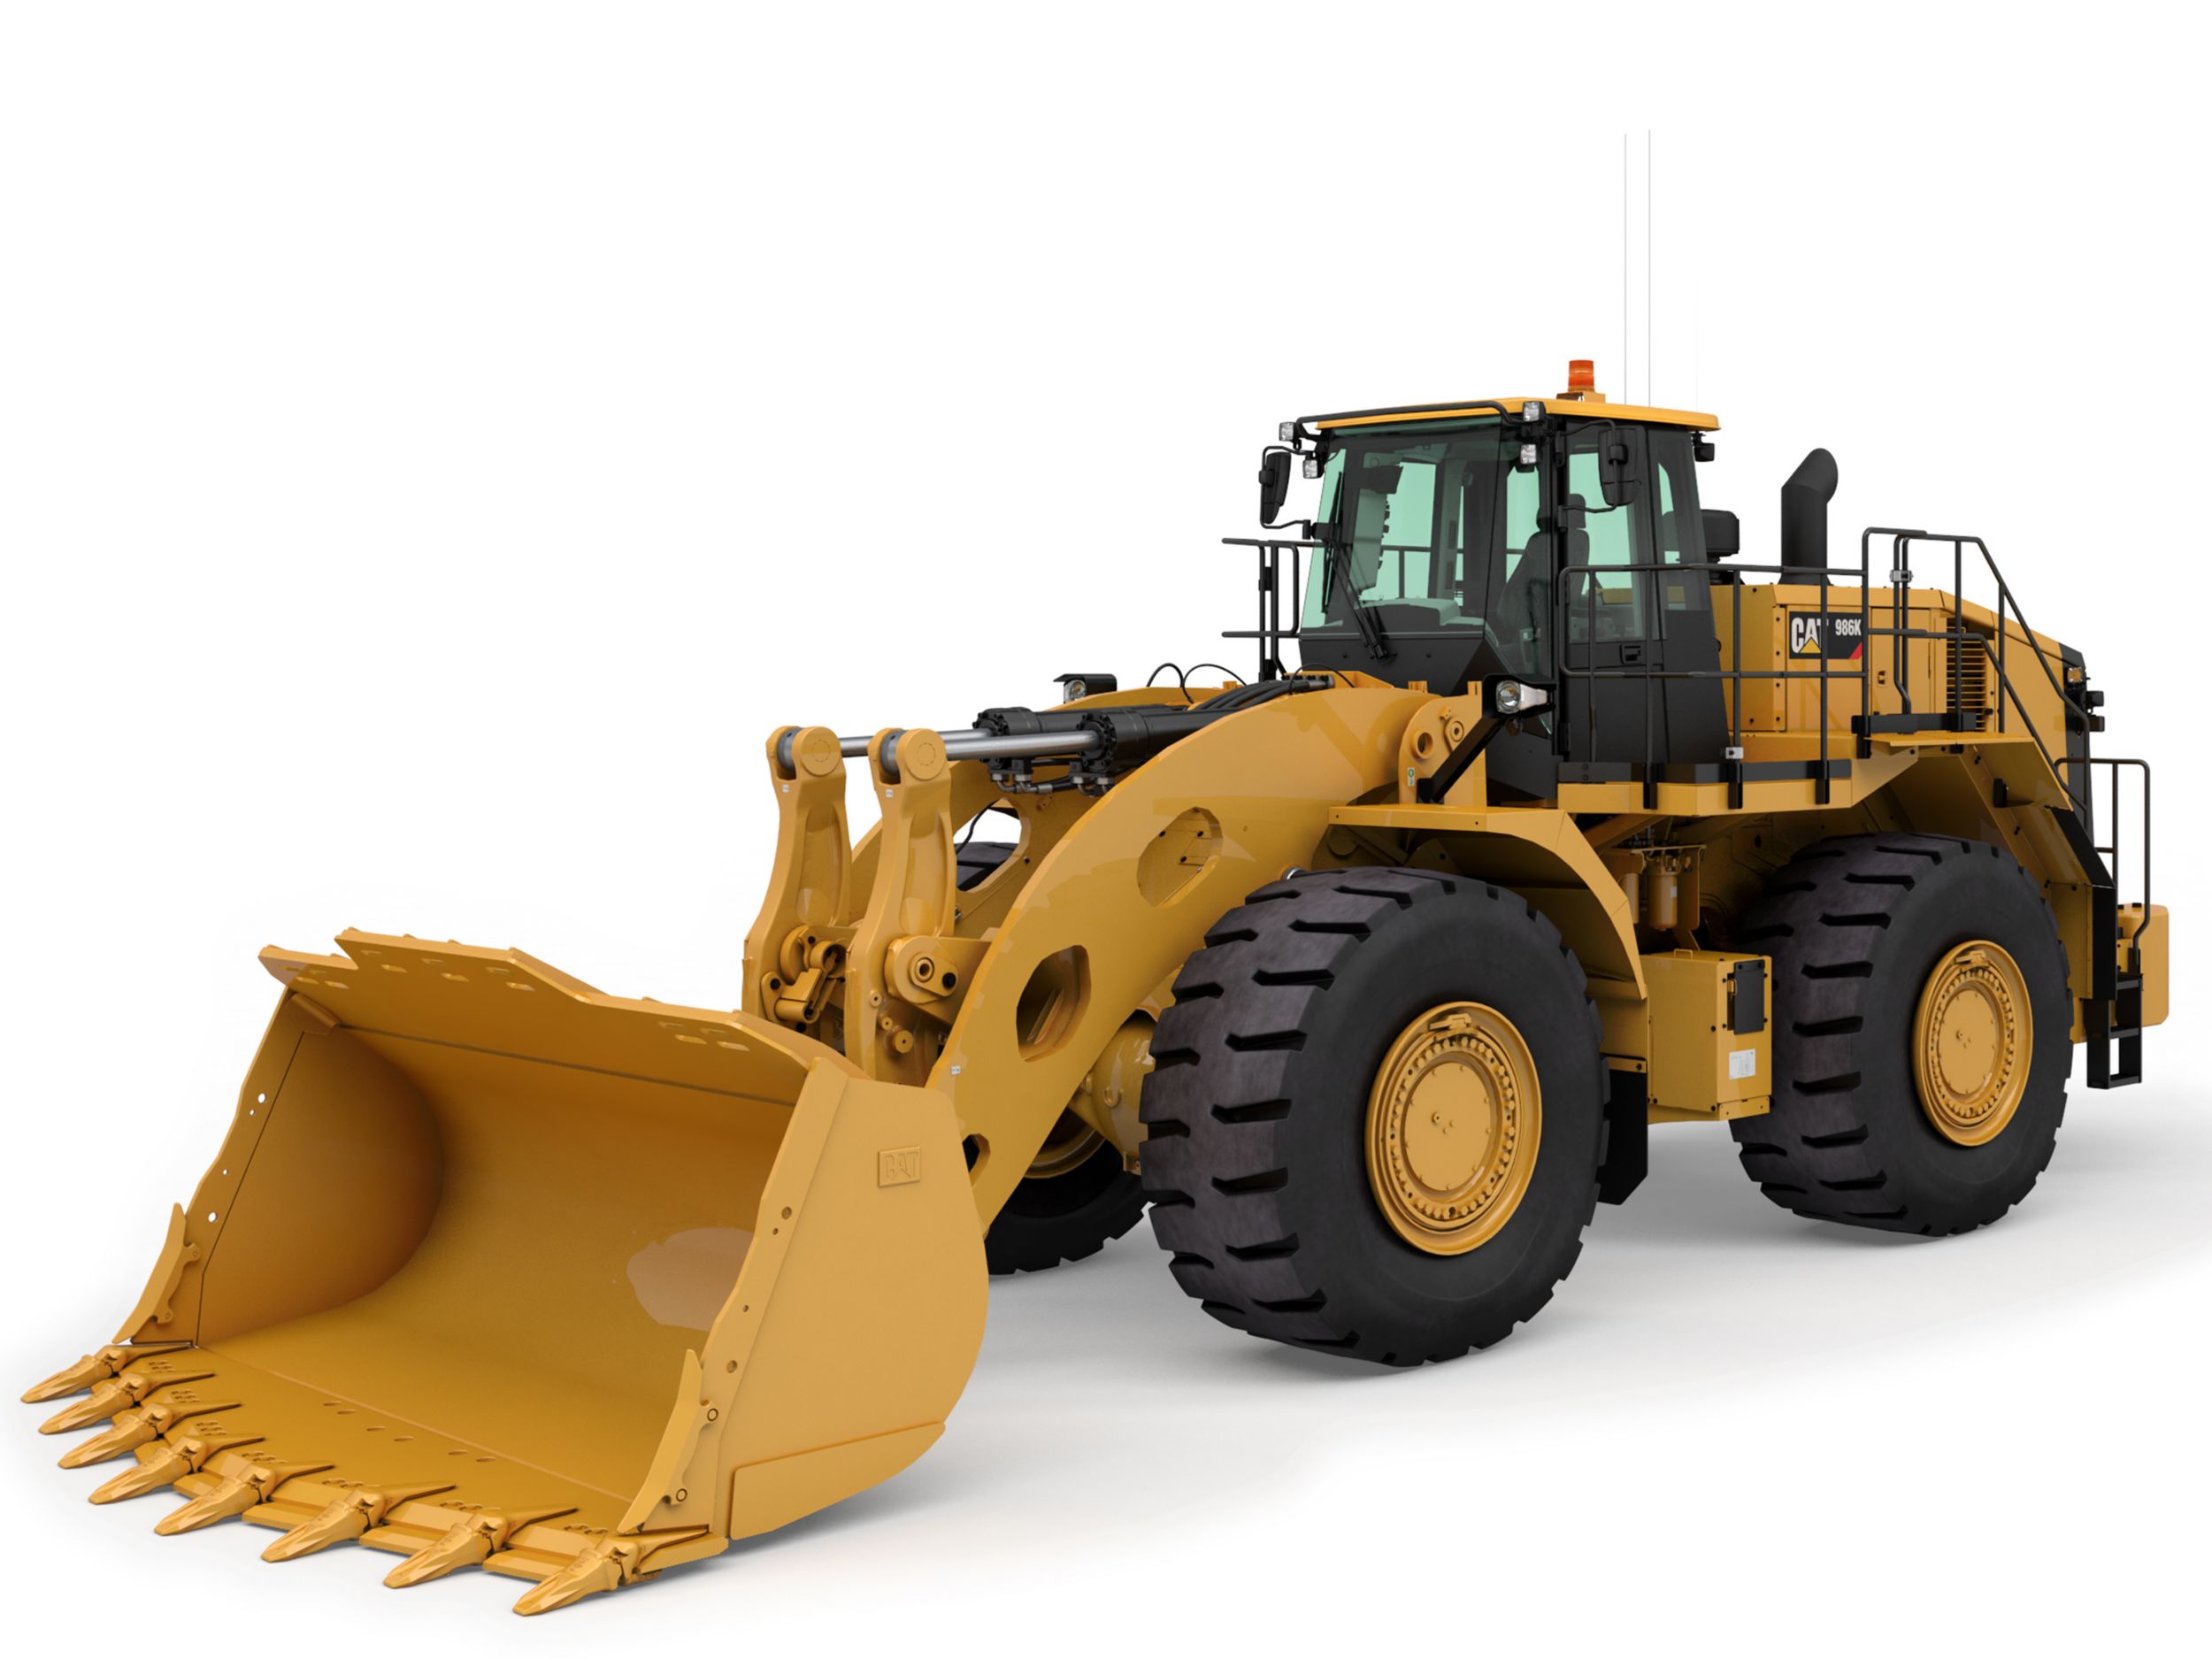
986K
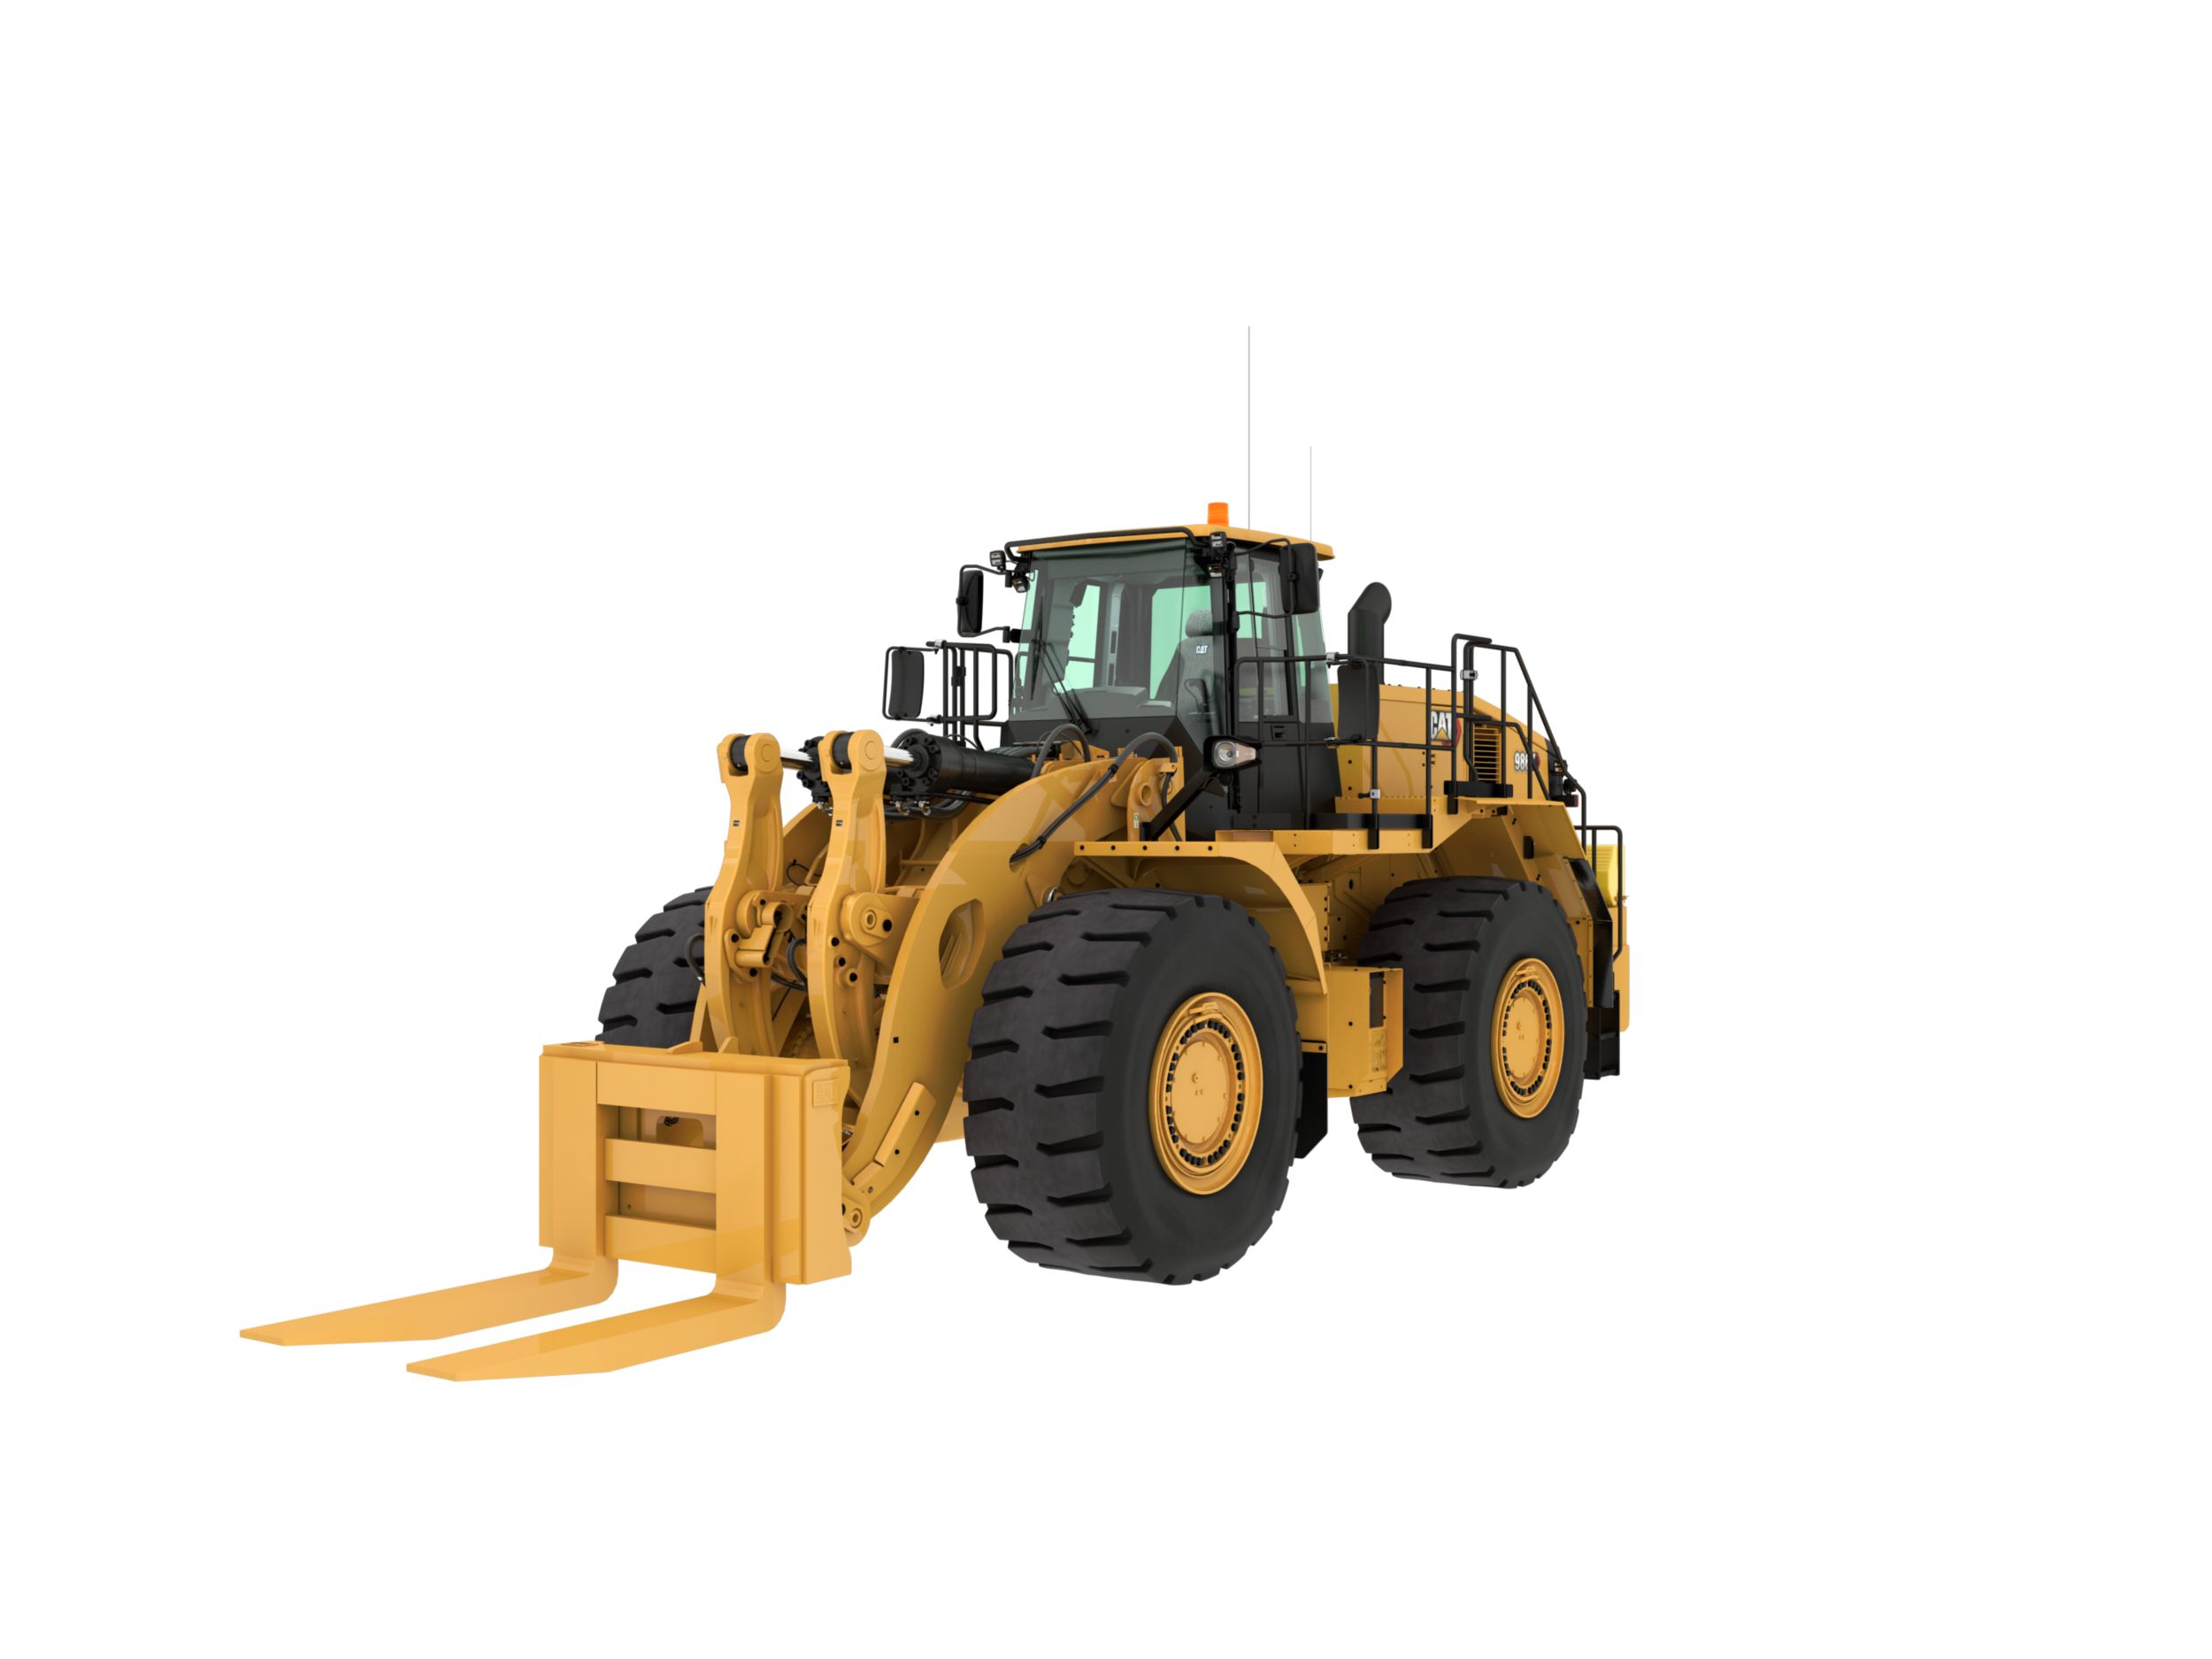
986K Block Handler Arrangement
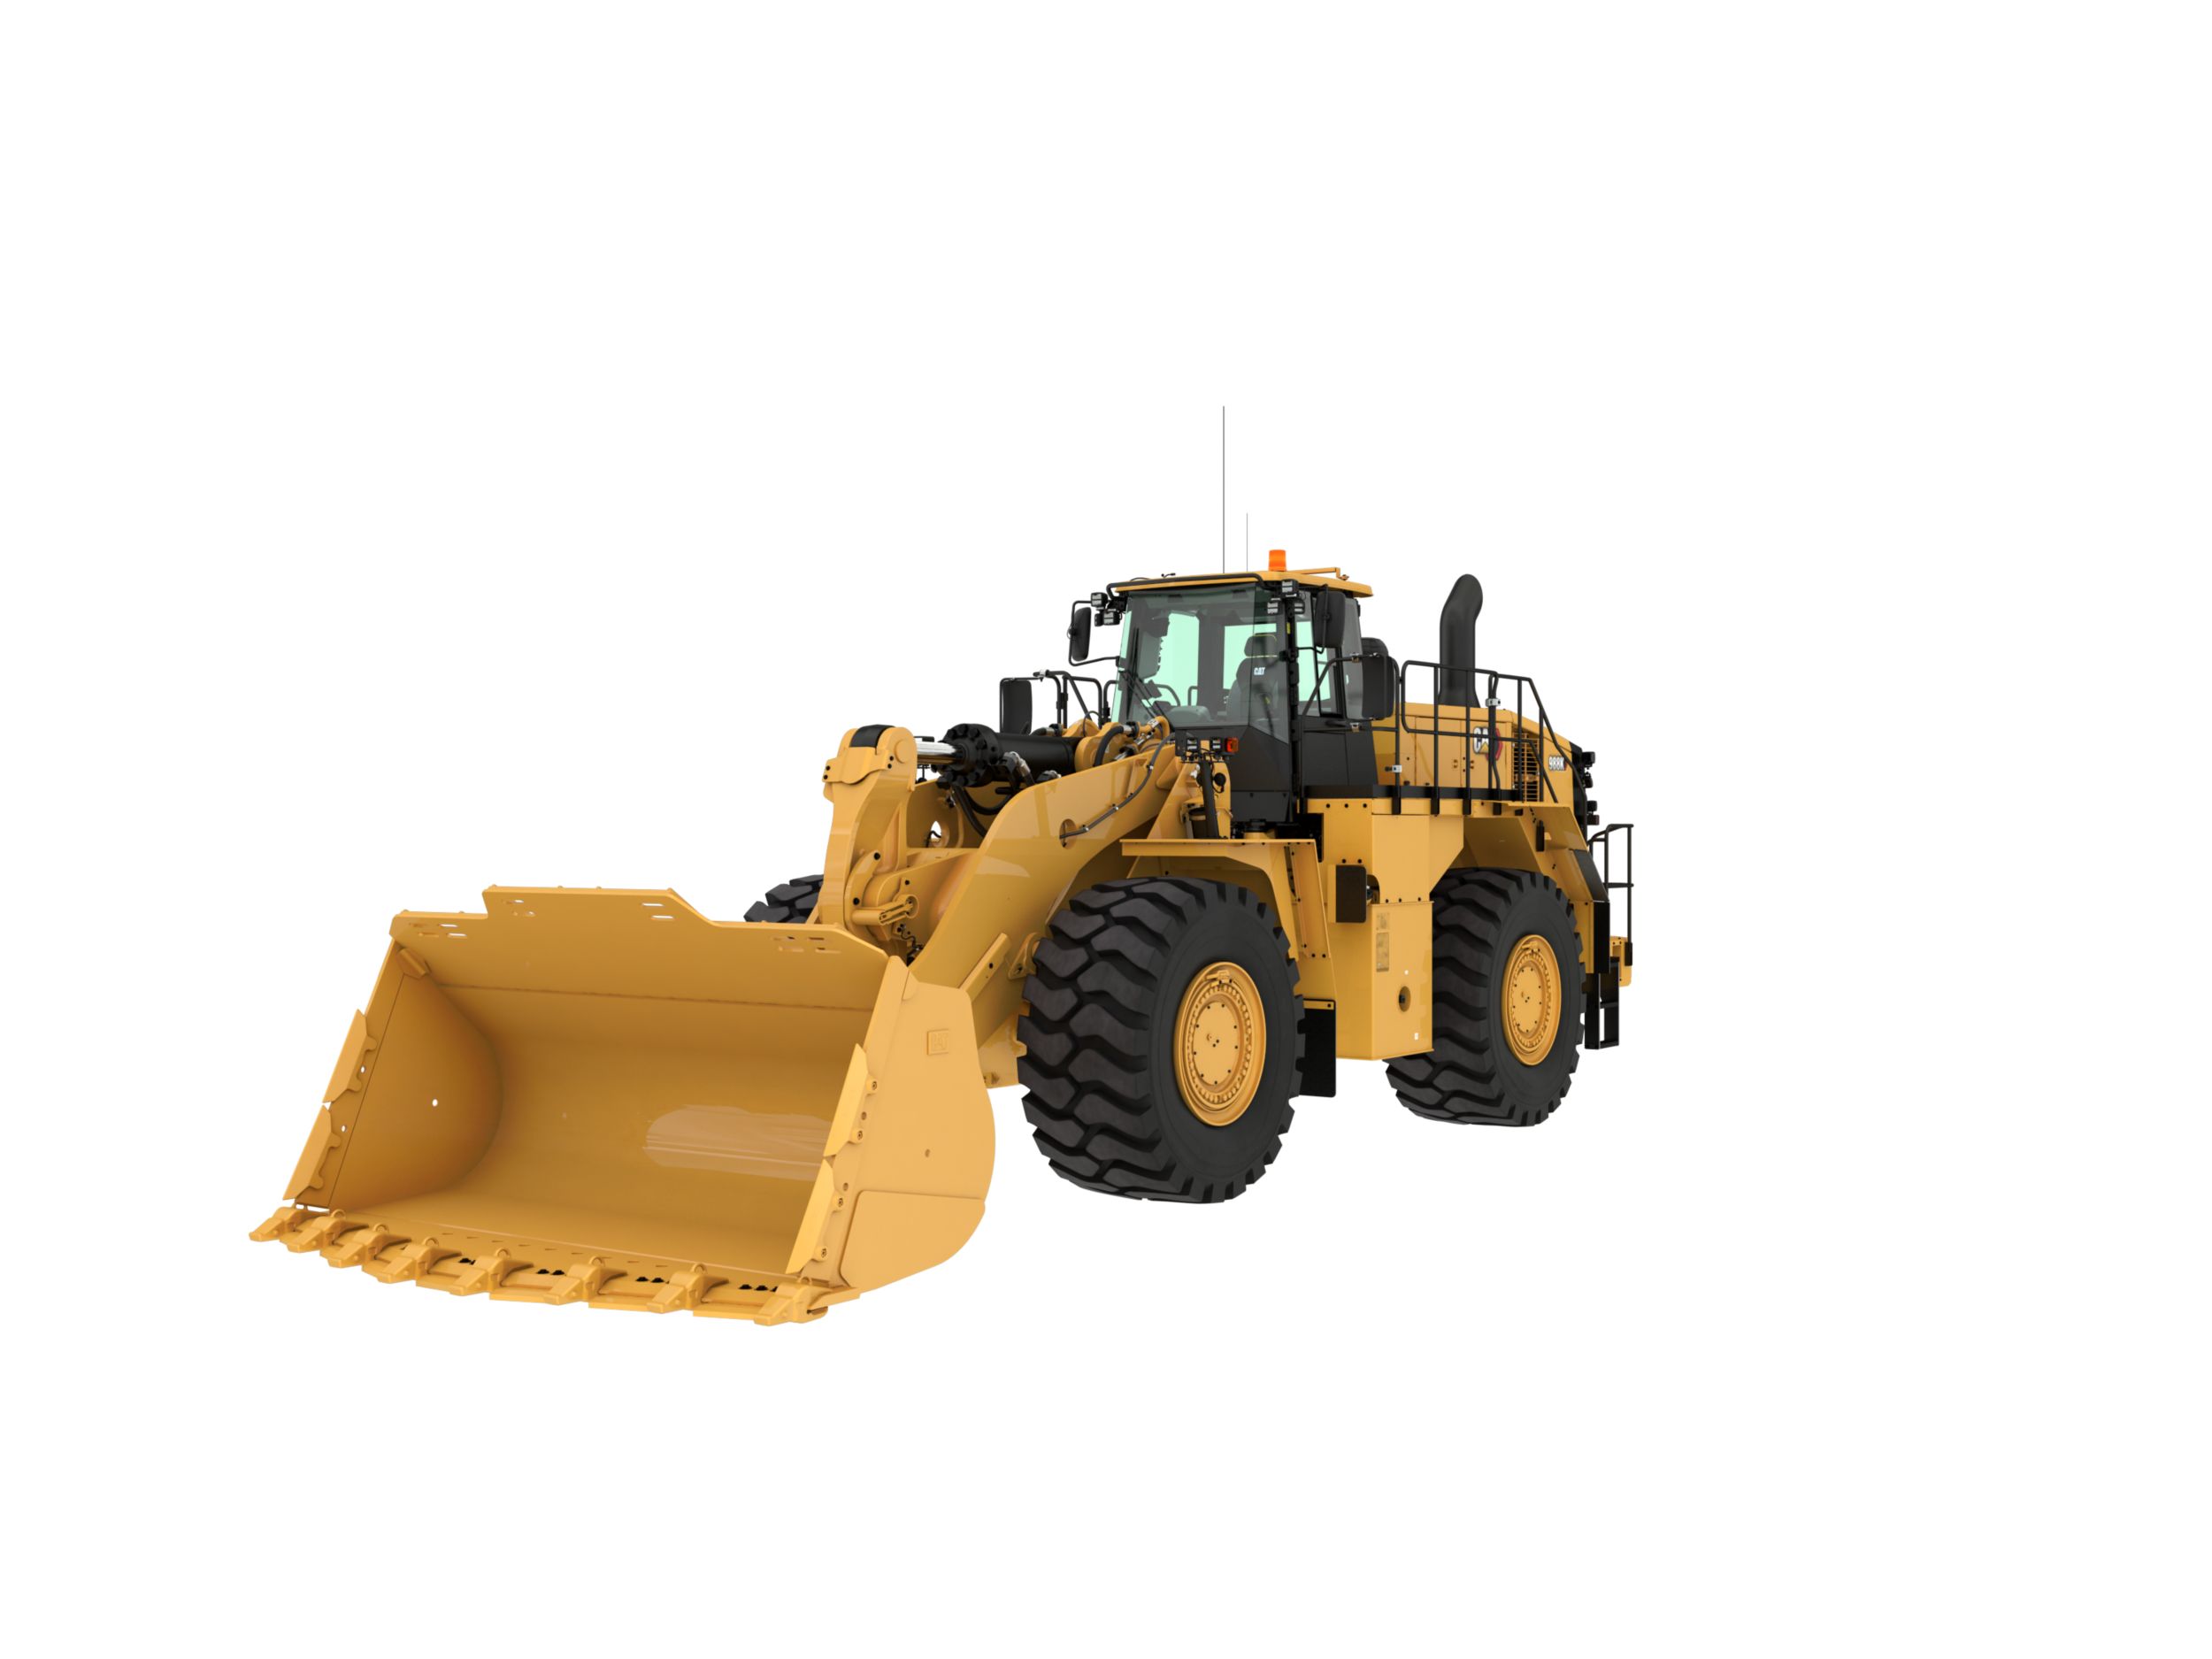
988K
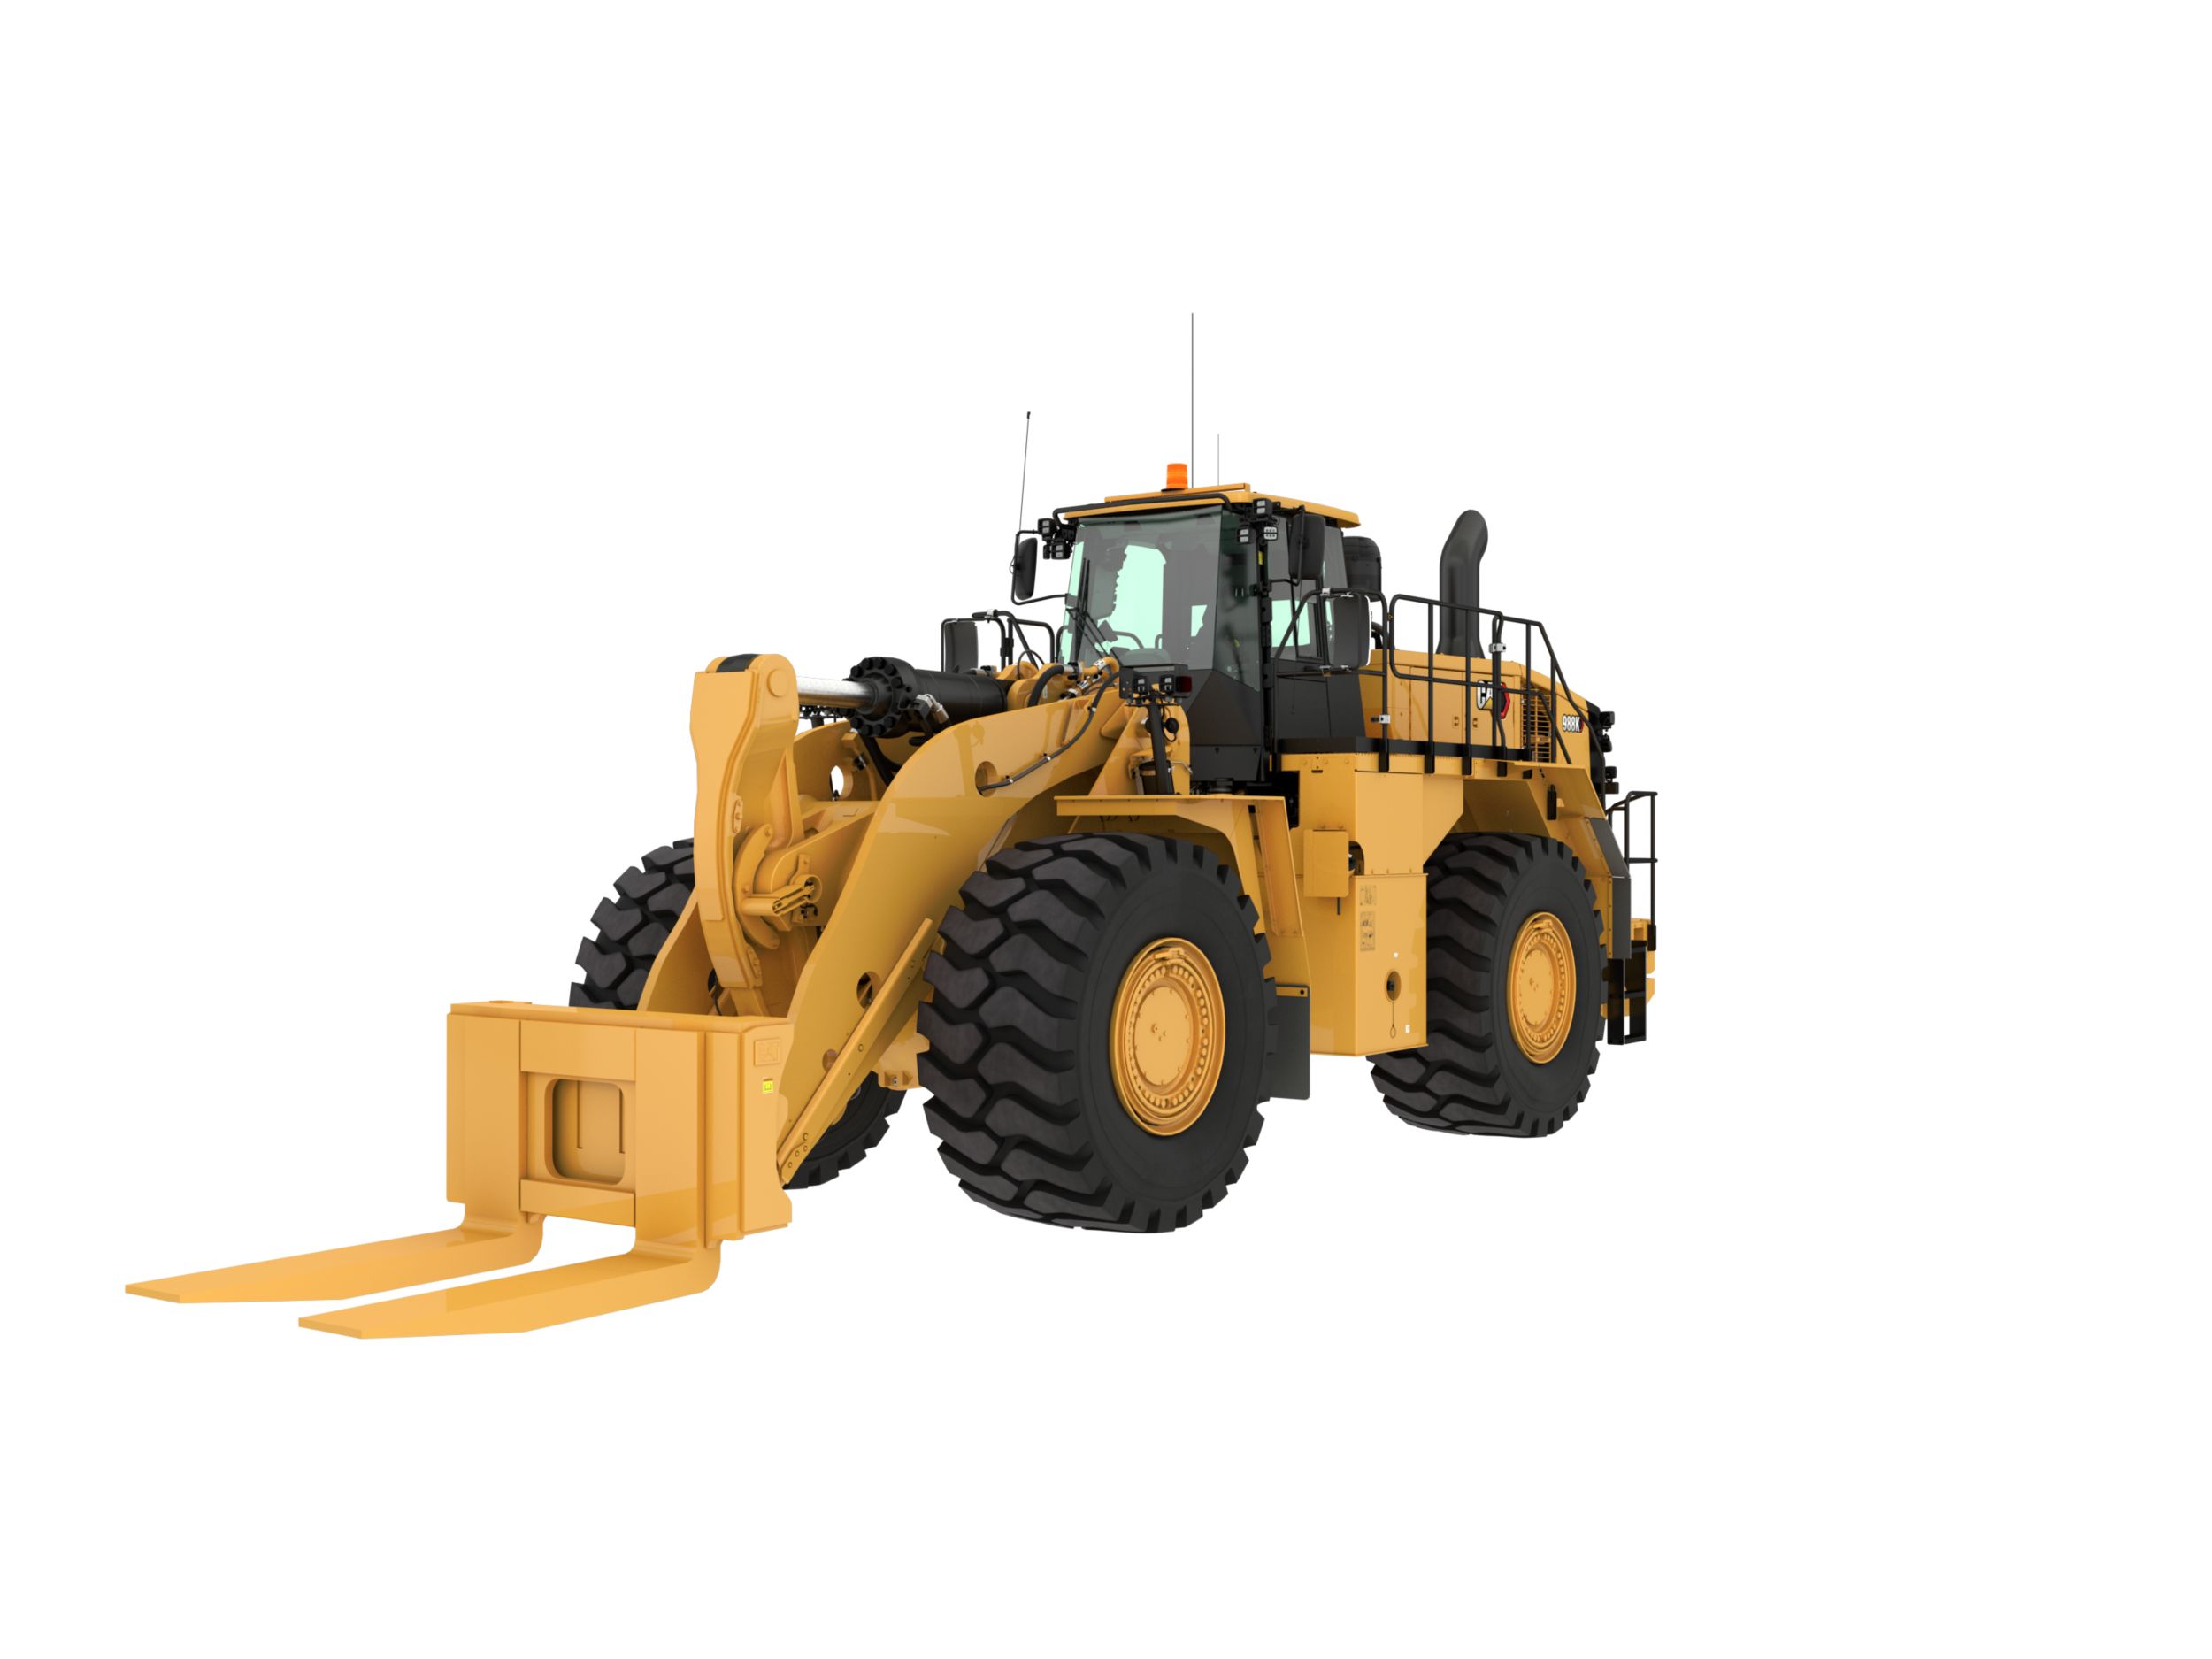
988K Block Handler Arrangement
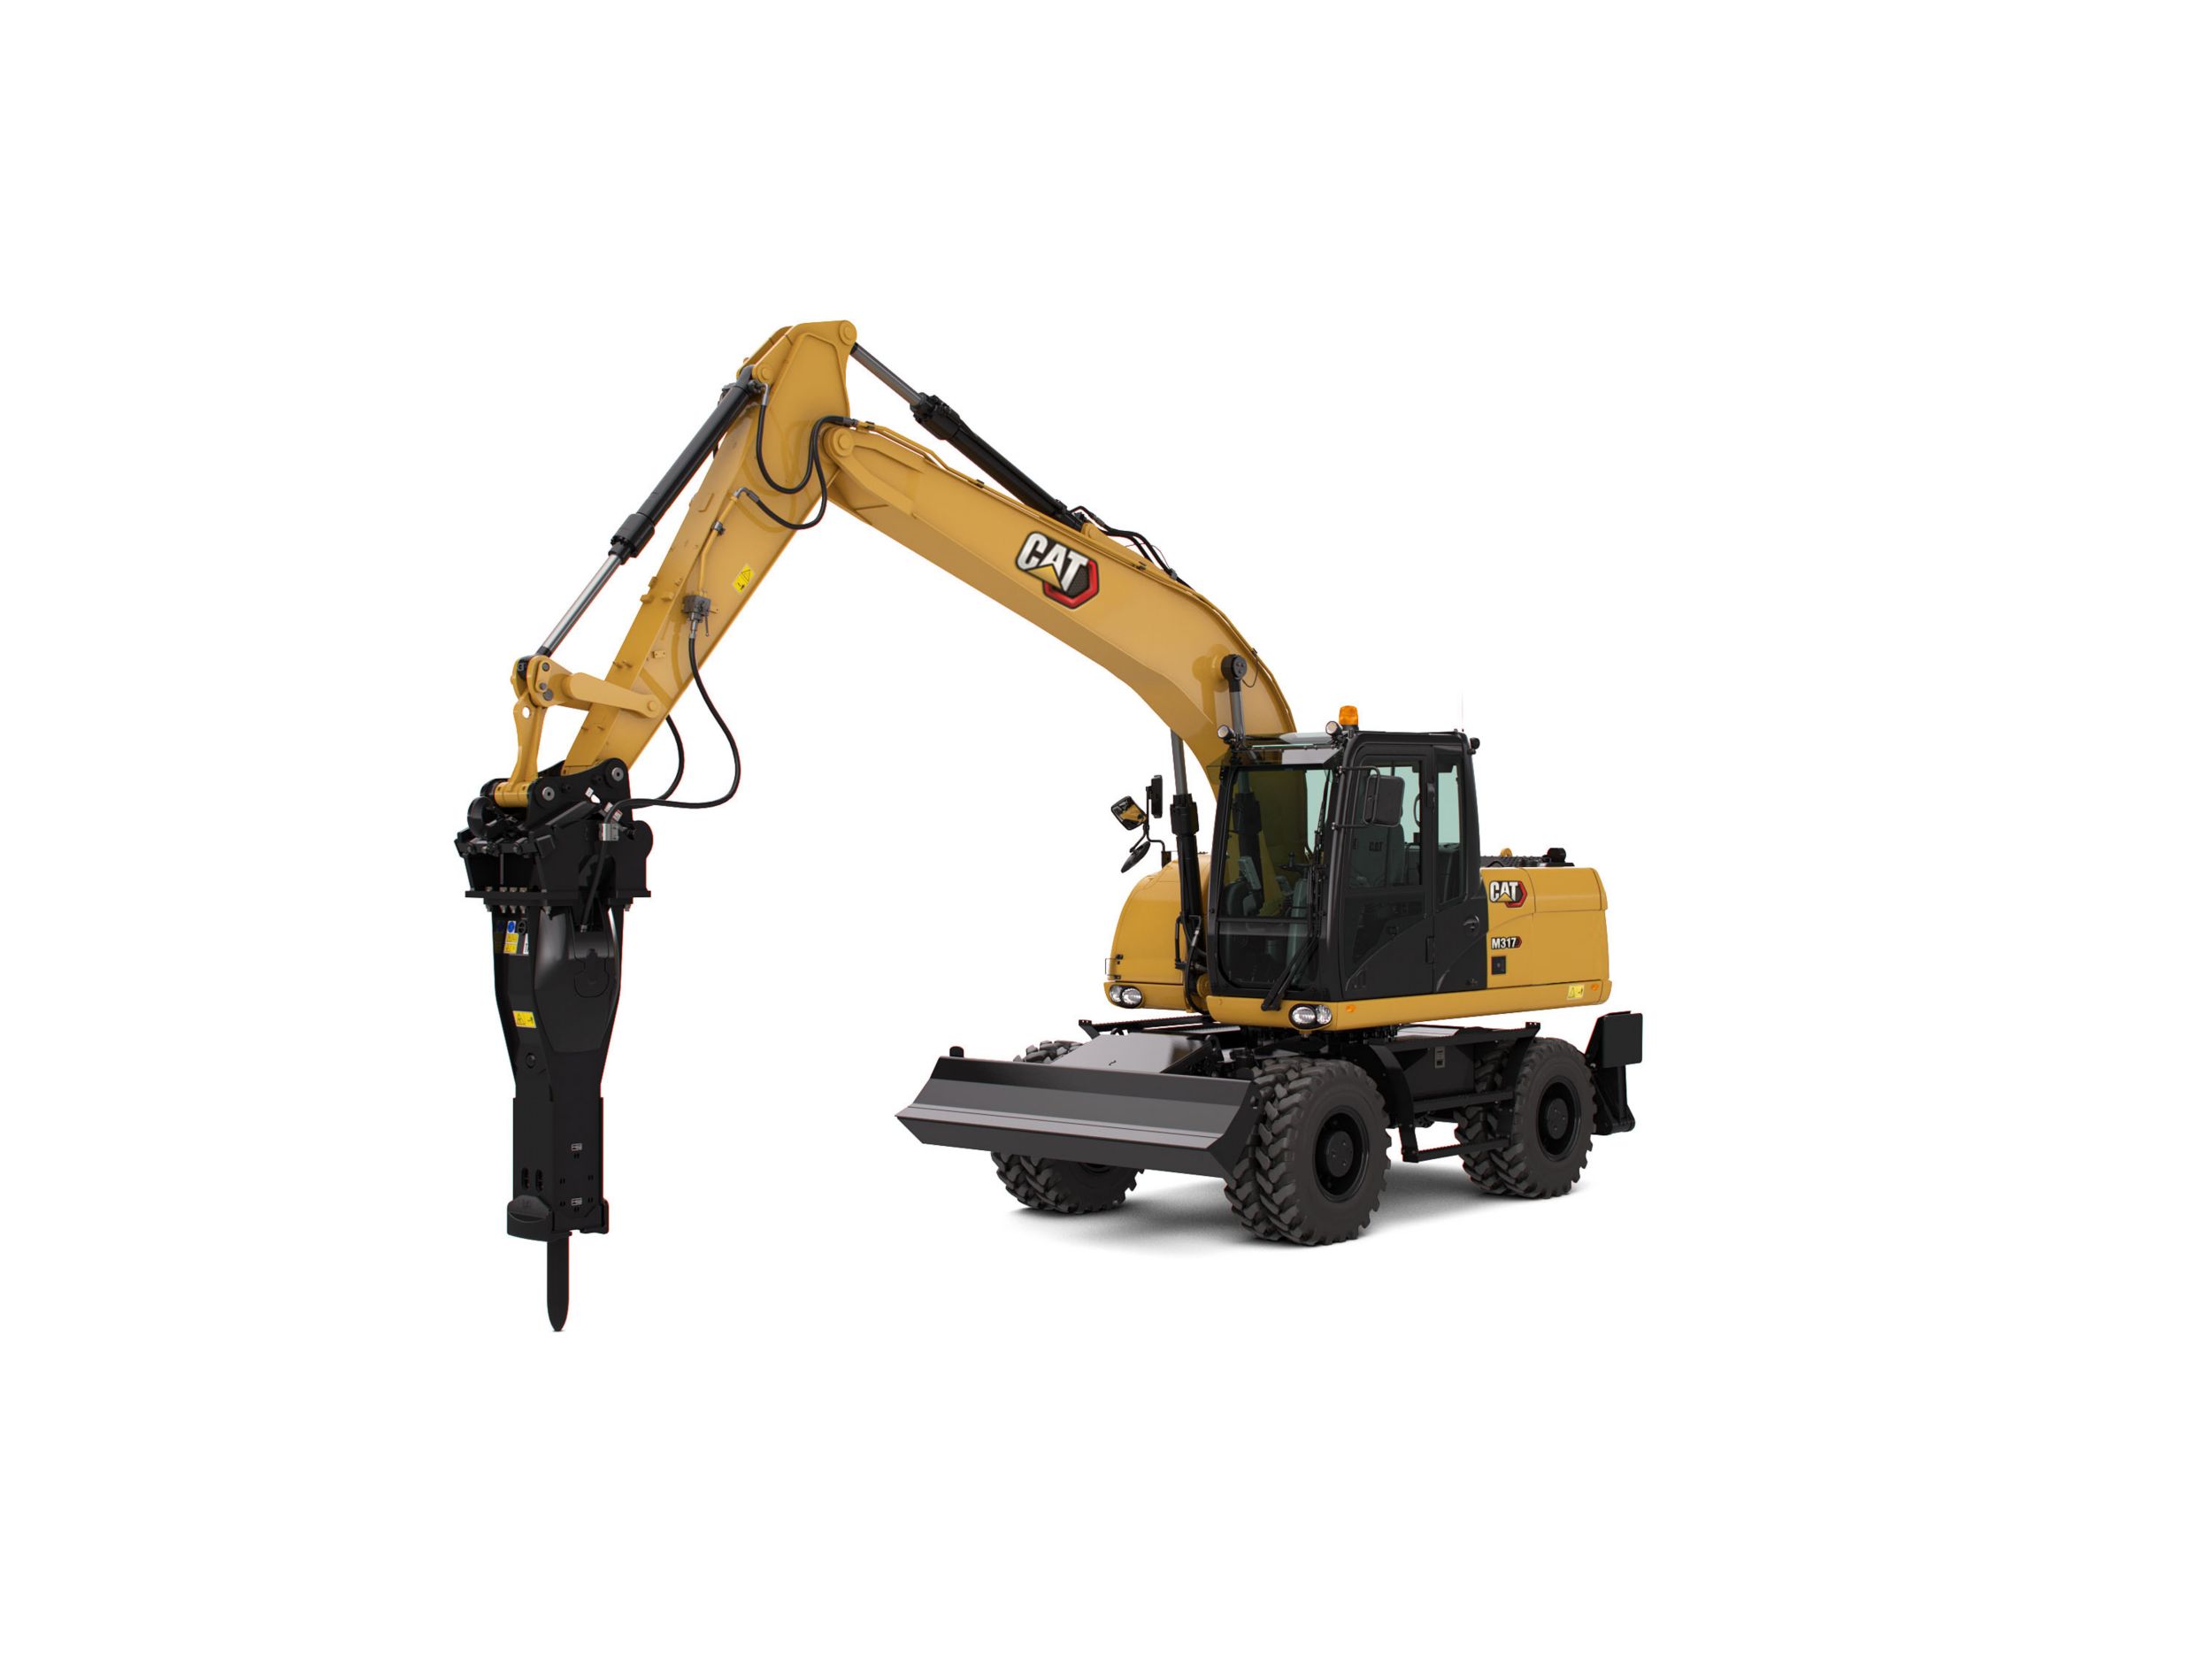
M317
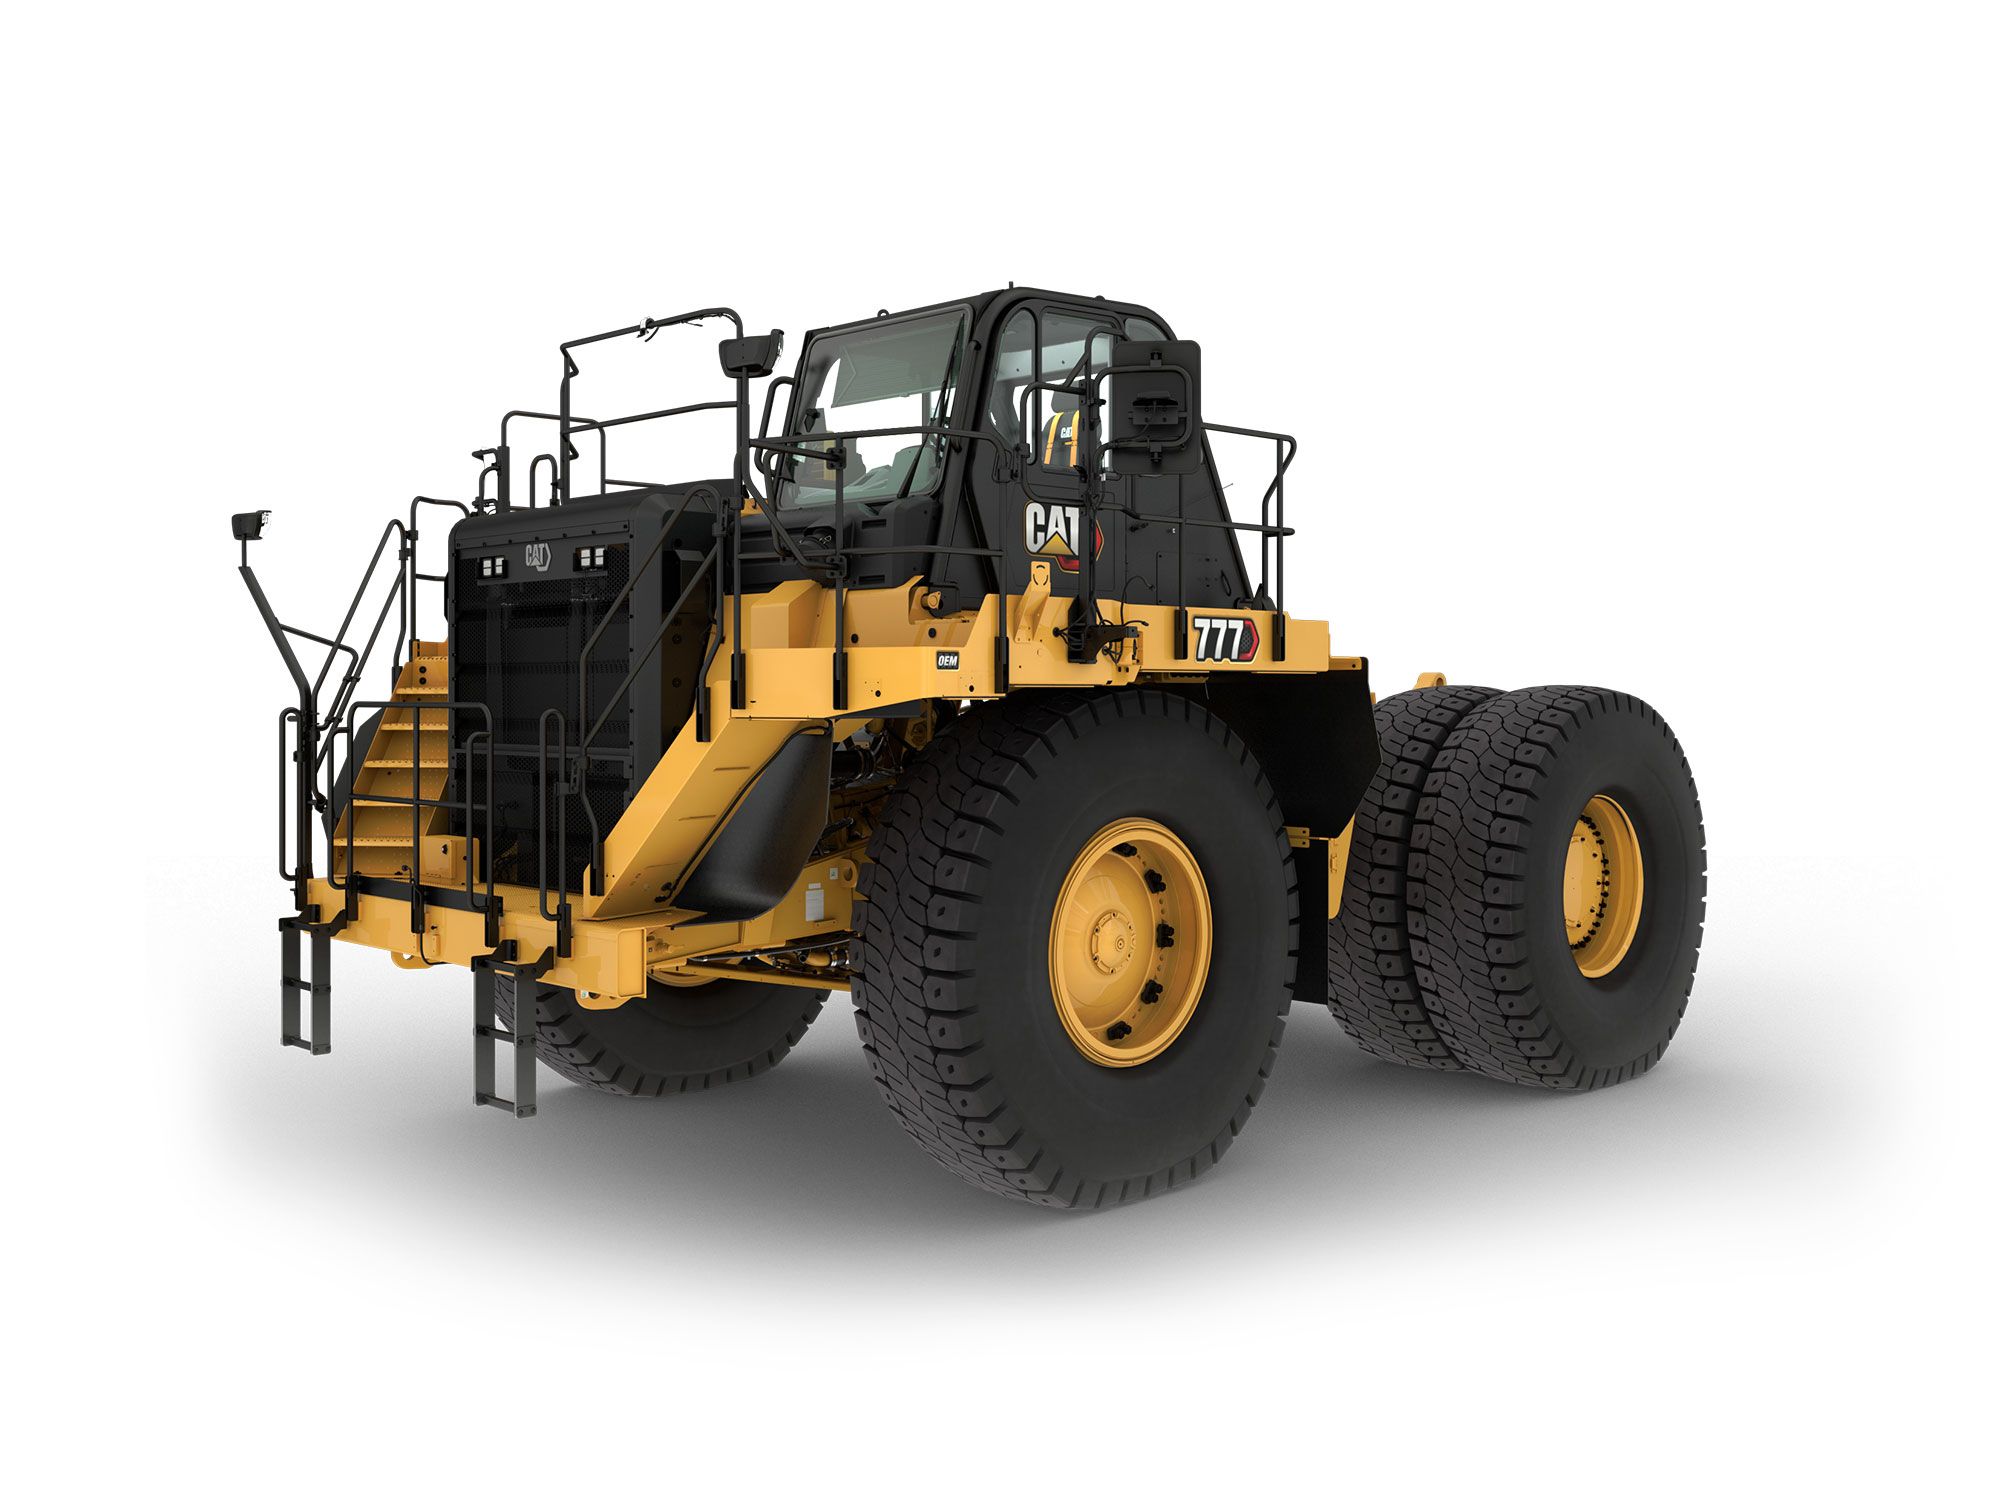
777 (07) Bare Chassis
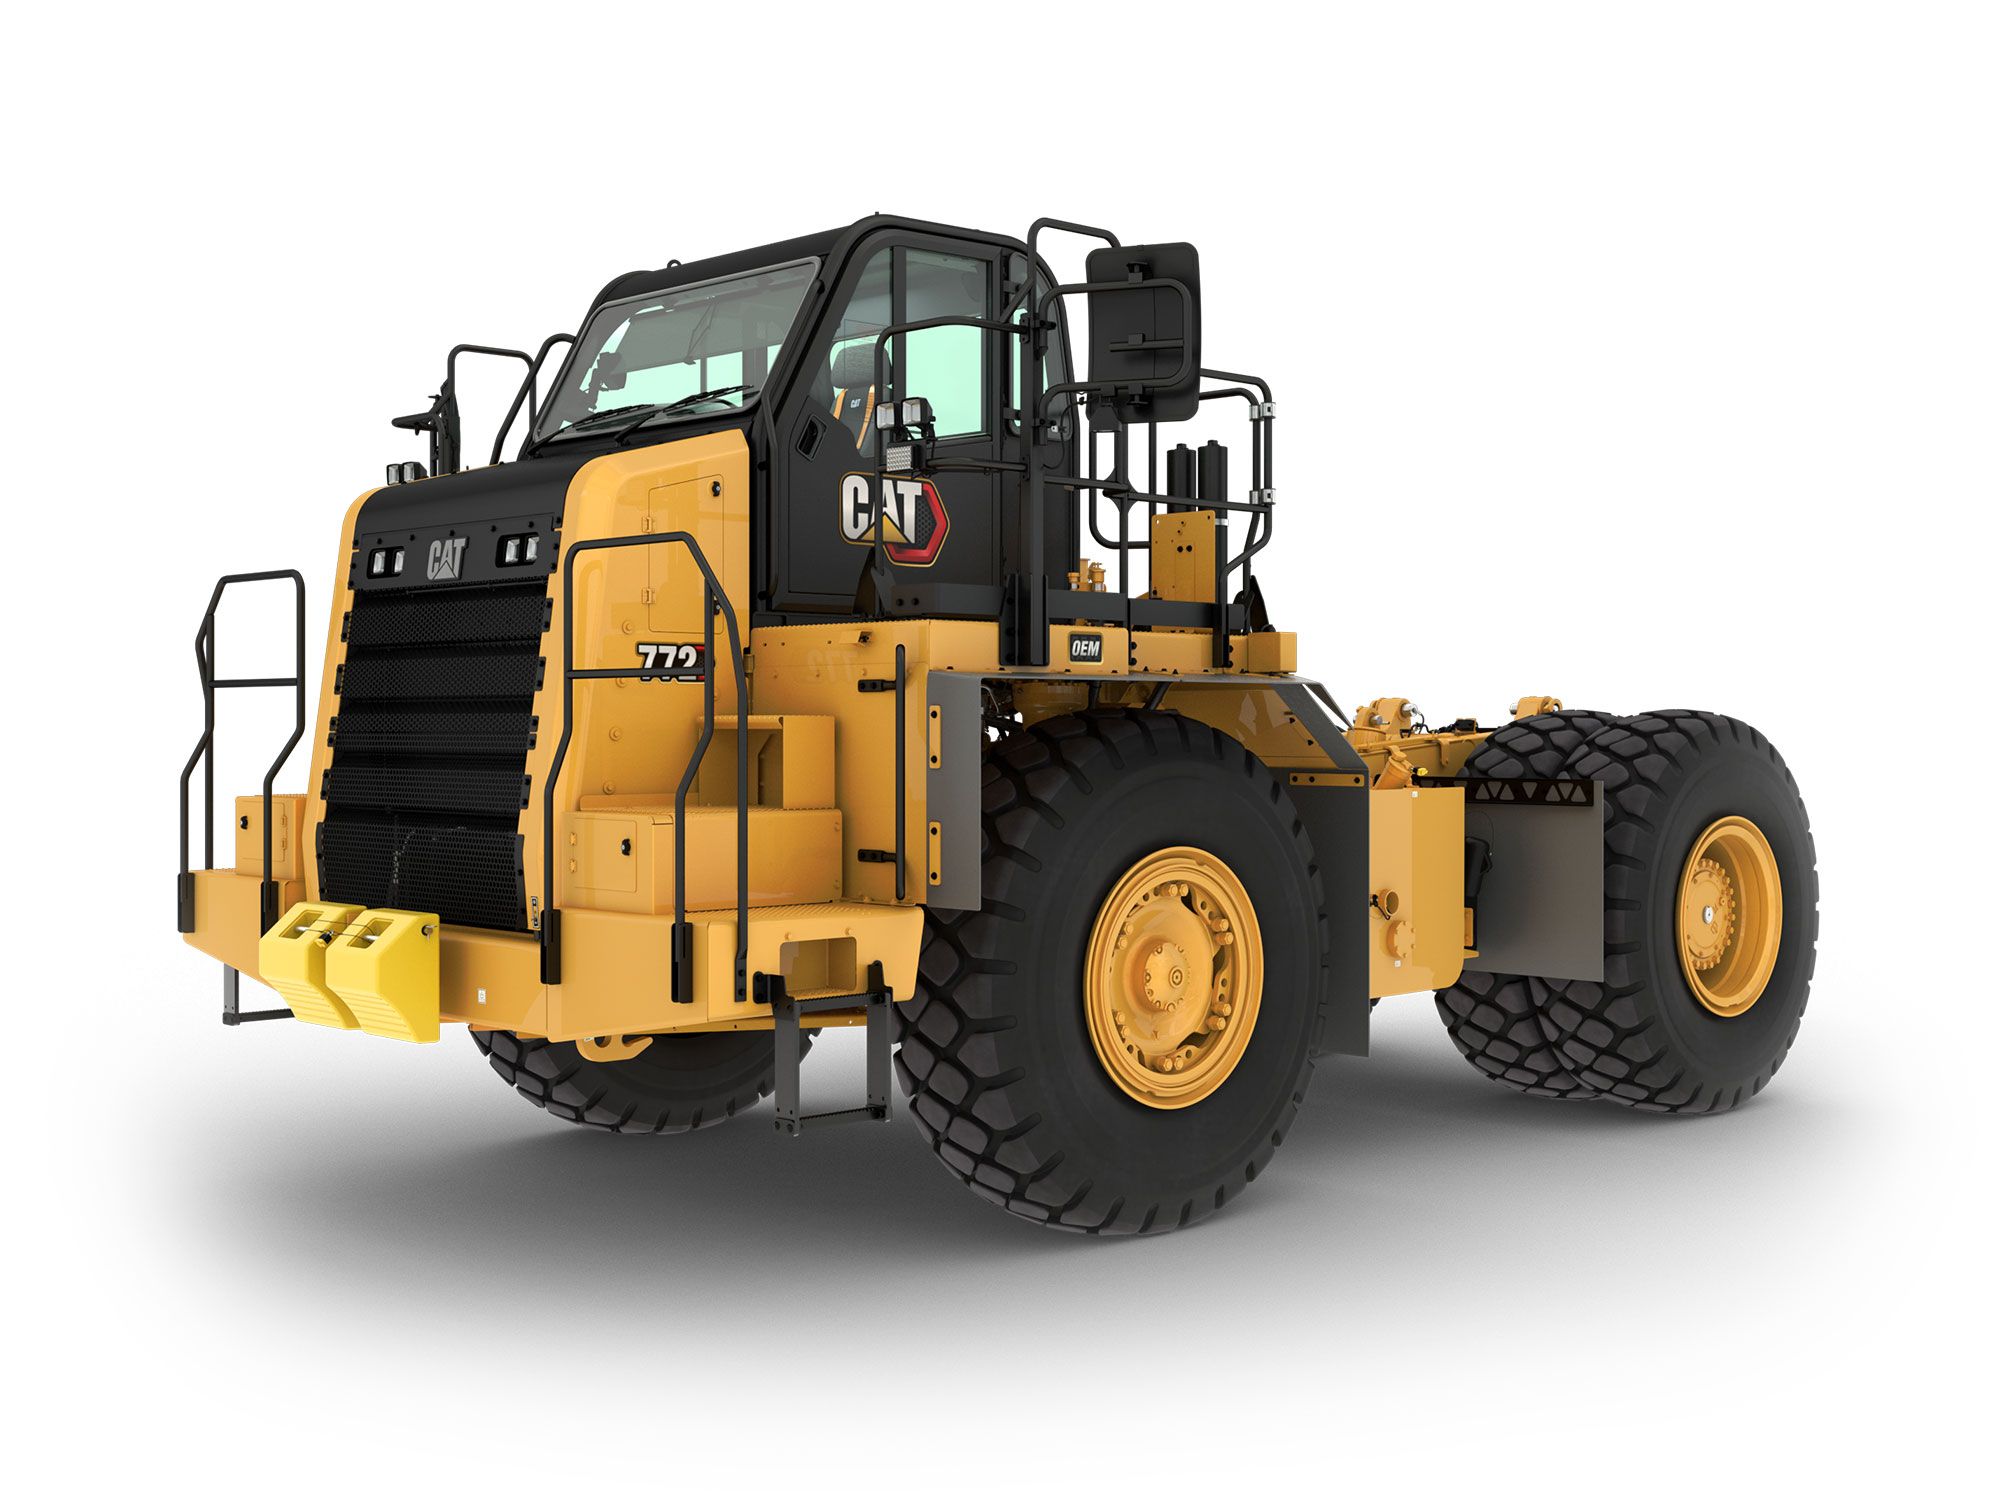
772 Bare Chassis